Dashboard Examples
Example Lovelace configurations for displaying 8311 HA Bridge data.
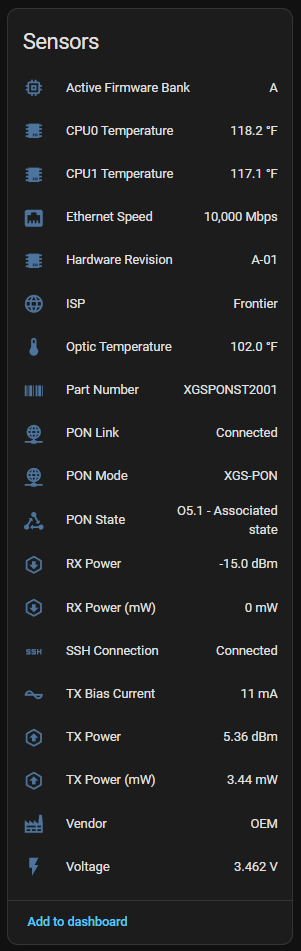
All sensors created by the integration, organized into Sensors and Diagnostic categories:
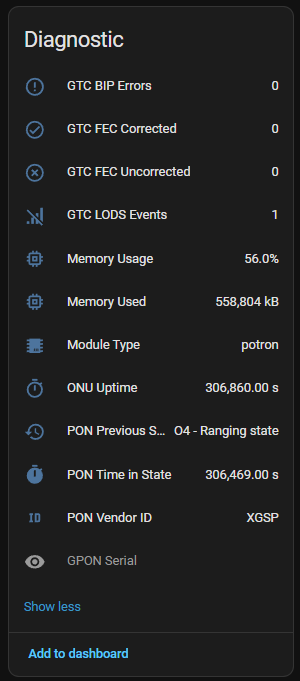
Diagnostic sensors include device identification and GTC error counters:
Entity IDs vary based on deployment method:
| Deployment | Example Entity ID |
|---|---|
| Docker/MQTT | sensor.8311_onu_was110_xgspon_rx_power |
| HACS | sensor.8311_onu_<serial>_rx_power |
Update the entity IDs in examples below to match your setup.
Simple entities card showing key metrics:
type: entities
title: Fiber ONT Status
entities:
  - entity: sensor.8311_onu_was110_xgspon_rx_power
    name: RX Power
  - entity: sensor.8311_onu_was110_xgspon_tx_power
    name: TX Power
  - entity: sensor.8311_onu_was110_xgspon_optic_temperature
    name: Temperature
  - entity: sensor.8311_onu_was110_xgspon_isp
    name: ISP
  - entity: binary_sensor.8311_onu_was110_xgspon_pon_link
name: PON LinkShow ISP, module type, and uptime:
type: entities
title: ONU Device Info
entities:
  - entity: sensor.8311_onu_was110_xgspon_isp
    name: ISP
  - entity: sensor.8311_onu_was110_xgspon_vendor
    name: Vendor
  - entity: sensor.8311_onu_was110_xgspon_module_type
    name: Module Type
  - entity: sensor.8311_onu_was110_xgspon_onu_uptime
    name: ONU Uptime
  - entity: sensor.8311_onu_was110_xgspon_memory_usage
    name: Memory Usage
  - entity: sensor.8311_onu_was110_xgspon_pon_state
name: PON StateRequires card-mod from HACS:
type: grid
columns: 3
cards:
  - type: tile
    entity: sensor.8311_onu_was110_xgspon_rx_power
    name: RX Power
    icon: mdi:arrow-down-bold-hexagon-outline
    color: green
    card_mod:
      style: |
        ha-card {
          {% set val = states(config.entity) | float(-100) %}
          {% if val < -28 %} --tile-color: #db4437;
          {% elif val < -27 %} --tile-color: #ffa600;
          {% endif %}
        }
  - type: tile
    entity: sensor.8311_onu_was110_xgspon_tx_power
    name: TX Power
    icon: mdi:arrow-up-bold-hexagon-outline
    color: green
    card_mod:
      style: |
        ha-card {
          {% set val = states(config.entity) | float(0) %}
          {% if val < 2 or val > 9 %} --tile-color: #db4437;
          {% elif val < 4 or val > 7 %} --tile-color: #ffa600;
          {% endif %}
        }
  - type: tile
    entity: sensor.8311_onu_was110_xgspon_optic_temperature
    name: Optic Temp
    icon: mdi:thermometer
    color: green
    card_mod:
      style: |
        ha-card {
          {% set val = states(config.entity) | float(0) %}
          {% if val > 70 %} --tile-color: #db4437;
          {% elif val > 60 %} --tile-color: #ffa600;
          {% endif %}
}Monitor fiber error counters:
type: entities
title: GTC Diagnostics
entities:
  - entity: sensor.8311_onu_was110_xgspon_gtc_bip_errors
    name: BIP Errors
  - entity: sensor.8311_onu_was110_xgspon_gtc_fec_corrected
    name: FEC Corrected
  - entity: sensor.8311_onu_was110_xgspon_gtc_fec_uncorrected
    name: FEC Uncorrected
  - entity: sensor.8311_onu_was110_xgspon_lods_events
name: LODS EventsTrack optical performance over time:
type: history-graph
title: Fiber Optical Performance
hours_to_show: 24
entities:
  - entity: sensor.8311_onu_was110_xgspon_rx_power
    name: RX Power
  - entity: sensor.8311_onu_was110_xgspon_tx_power
name: TX PowerRequires history-explorer-card and Mushroom from HACS.
Choose based on your deployment:
- HACS Dashboard - For HACS integration users
- Docker Dashboard - For Docker/MQTT bridge users
The main difference is entity ID format:
- HACS:
sensor.8311_onu_<serial>_rx_power - Docker:
sensor.8311_onu_was110_xgspon_rx_power
alias: "Alert: Fiber Bridge Offline"
trigger:
  - platform: state
    entity_id: binary_sensor.8311_onu_was110_xgspon_pon_link
    to: "off"
    for:
      minutes: 5
action:
  - service: notify.mobile_app
    data:
      title: "Fiber Connection Lost"
message: "PON link is down on 8311 ONU"alias: "Alert: Low Fiber RX Power"
trigger:
- platform: numeric_state
entity_id: sensor.8311_onu_was110_xgspon_rx_power
below: -27
for:
minutes: 10
action:
- service: notify.mobile_app
data:
title: "Fiber Signal Warning"
message: "RX power is {{ states('sensor.8311_onu_was110_xgspon_rx_power') }} dBm"alias: "Alert: Fiber FEC Errors"
trigger:
- platform: state
entity_id: sensor.8311_onu_was110_xgspon_gtc_fec_uncorrected
action:
- condition: template
value_template: >
{{ trigger.to_state.state | int(0) > trigger.from_state.state | int(0) }}
- service: notify.mobile_app
data:
title: "Fiber Quality Warning"
message: "Uncorrectable FEC errors increased to {{ states('sensor.8311_onu_was110_xgspon_gtc_fec_uncorrected') }}"Share your dashboard configs! Open a PR or submit an issue with your setup.