Simple HTML visualization of the quantitative research results
When you run quantitative researches through external agencies, they commonly give you the SAV file (format used by the IBM SPSS software package).
SPSS is very expensive, requires skills, and may be an overkill for most tasks.
The tool uses raw CSV data exported from SAV to create HTML visualizations.
I don't have SPSS, so I used a free GNU alternative called PSPP.
The usage is as follows:
- Load the SAV file in PSPP.
-
Export the data to CSV through running the following commands (syntaxes):
- SAVE TRANSLATE /OUTFILE="data_values.csv" /TYPE=CSV /FIELDNAMES.
- SAVE TRANSLATE /OUTFILE="data_labels.csv" /TYPE=CSV /FIELDNAMES /CELLS=LABELS.
-
Then run the syntax
- DISPLAY LABELS.
- These 3 files contain all the data required to visualize the survey.
- See the next steps in research-visualizer.py.
Here's how it looks in real life:
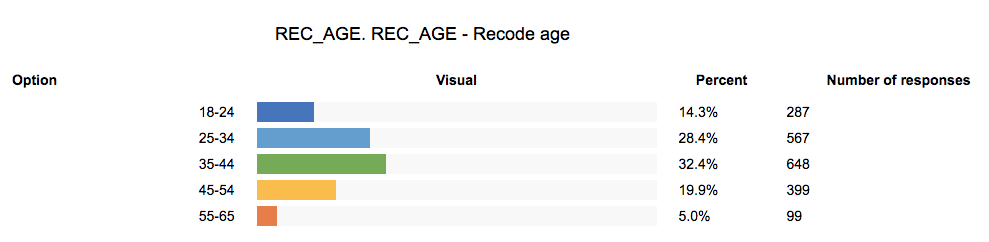
Good enough to insert into presentations, etc.