This guide walks you through your first Spring Boot project with Tanzu Observability by Wavefront.
You will create a simple web application and configure it to send metrics to a freemium cluster.
You can use this pre-initialized project and click Generate to download a ZIP file. This project is configured to fit the examples in this tutorial.
If you want to initialize the project manually, follow the steps given below:
-
Navigate to https://start.spring.io. This service pulls in all the dependencies you need for an application and does most of the setup for you.
-
Select your favorite build system and language. This guide assumes you’ve selected Java and Maven.
-
Click Add dependencies and select Spring Web and then Wavefront.
-
Click Generate. You download a ZIP file, which is an archive of a web application that includes Tanzu Observability.
|
Note
|
If your IDE has the Spring Initializr integration, you can complete the steps above from your IDE. |
Follow these steps to start the project and to automatically send several auto-configured metrics to Tanzu Observability by Wavefront.
-
Add the Wavefront for Spring Boot 3 starter to the Maven dependencies. Open the
pom.xmland add the following to the<dependencies>block:<dependency> <groupId>com.wavefront</groupId> <artifactId>wavefront-spring-boot-starter</artifactId> <version>3.0.1</version> </dependency>
-
Before you start the service, configure the project so that you can identify the metrics sent by the application and service. Open the
application.propertiesfile and add the following:management.wavefront.application.name=demo management.wavefront.application.service-name=getting-started
NoteThe properties above configure the integration to send metrics to Tanzu Observability by Wavefront using the demoapplication and thegetting-startedservice. An application can consist of an arbitrary number of microservices. -
Run the application from your IDE by invoking the
mainmethod ofDemoApplication. You see the following:INFO 58371 --- [ main] o.s.b.a.e.web.EndpointLinksResolver : Exposing 1 endpoint(s) beneath base path '/actuator' INFO 58371 --- [ main] o.s.b.w.embedded.tomcat.TomcatWebServer : Tomcat started on port(s): 8080 (http) with context path '' INFO 58371 --- [ main] hello.DemoApplication : Started DemoApplication in 1.705 seconds (process running for 2.038) A Wavefront account has been provisioned successfully and the API token has been saved to disk. To share this account, make sure the following is added to your configuration: management.wavefront.api-token=ee1f454b-abcd-efgh-1234-bb449f6a25ed management.wavefront.uri=https://wavefront.surf Connect to your Wavefront dashboard using this one-time use link: https://wavefront.surf/us/AtoKen
What Happened?
-
Without any extra information, an account on a Freemium cluster was automatically provisioned for you.
-
An API token was created for you.
-
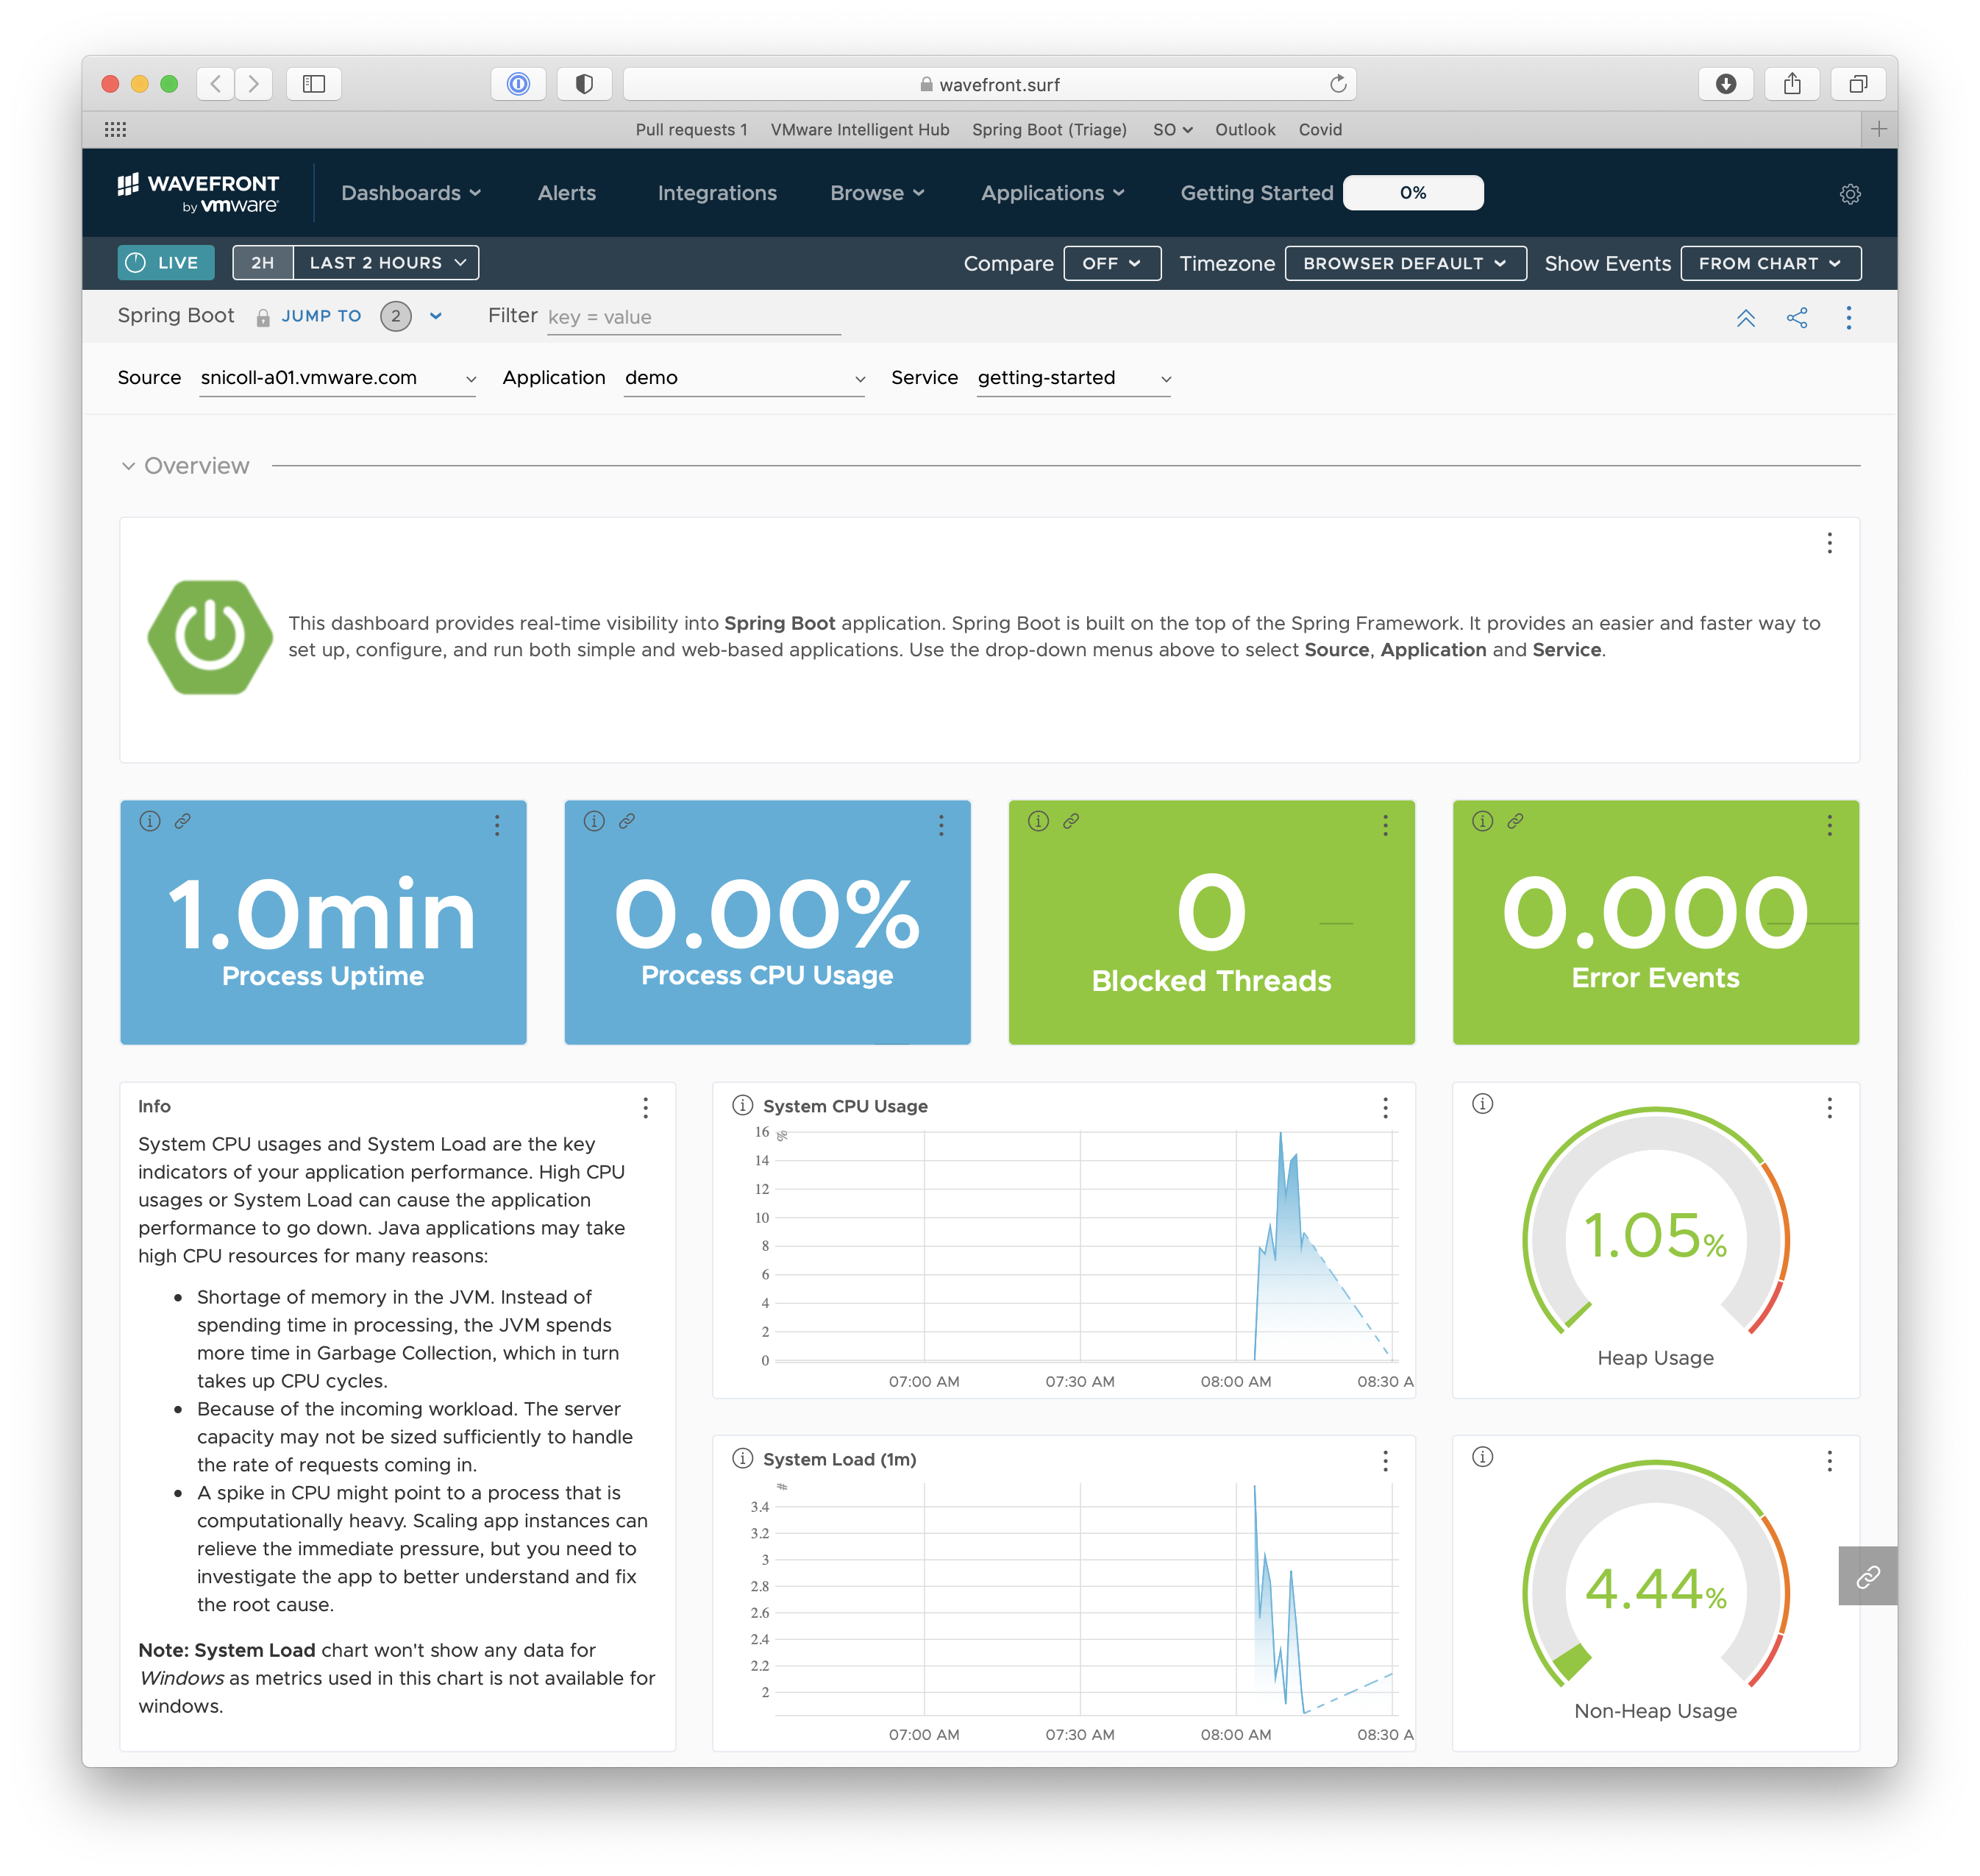
To let you access your dashboard on the Freemium cluster, a one-time use link was logged when the application started. The link starts with
https://wavefront.surf. Copy this link into your favorite browser and explore the out-of-the-box Spring Boot dashboard:
Next, you can create a simple controller to see how HTTP traffic is automatically instrumented. The following listing shows how to do so:
link:complete/src/main/java/hello/DemoController.java[role=include]-
Restart the application and trigger
http://localhost:8080from your browser multiple times. -
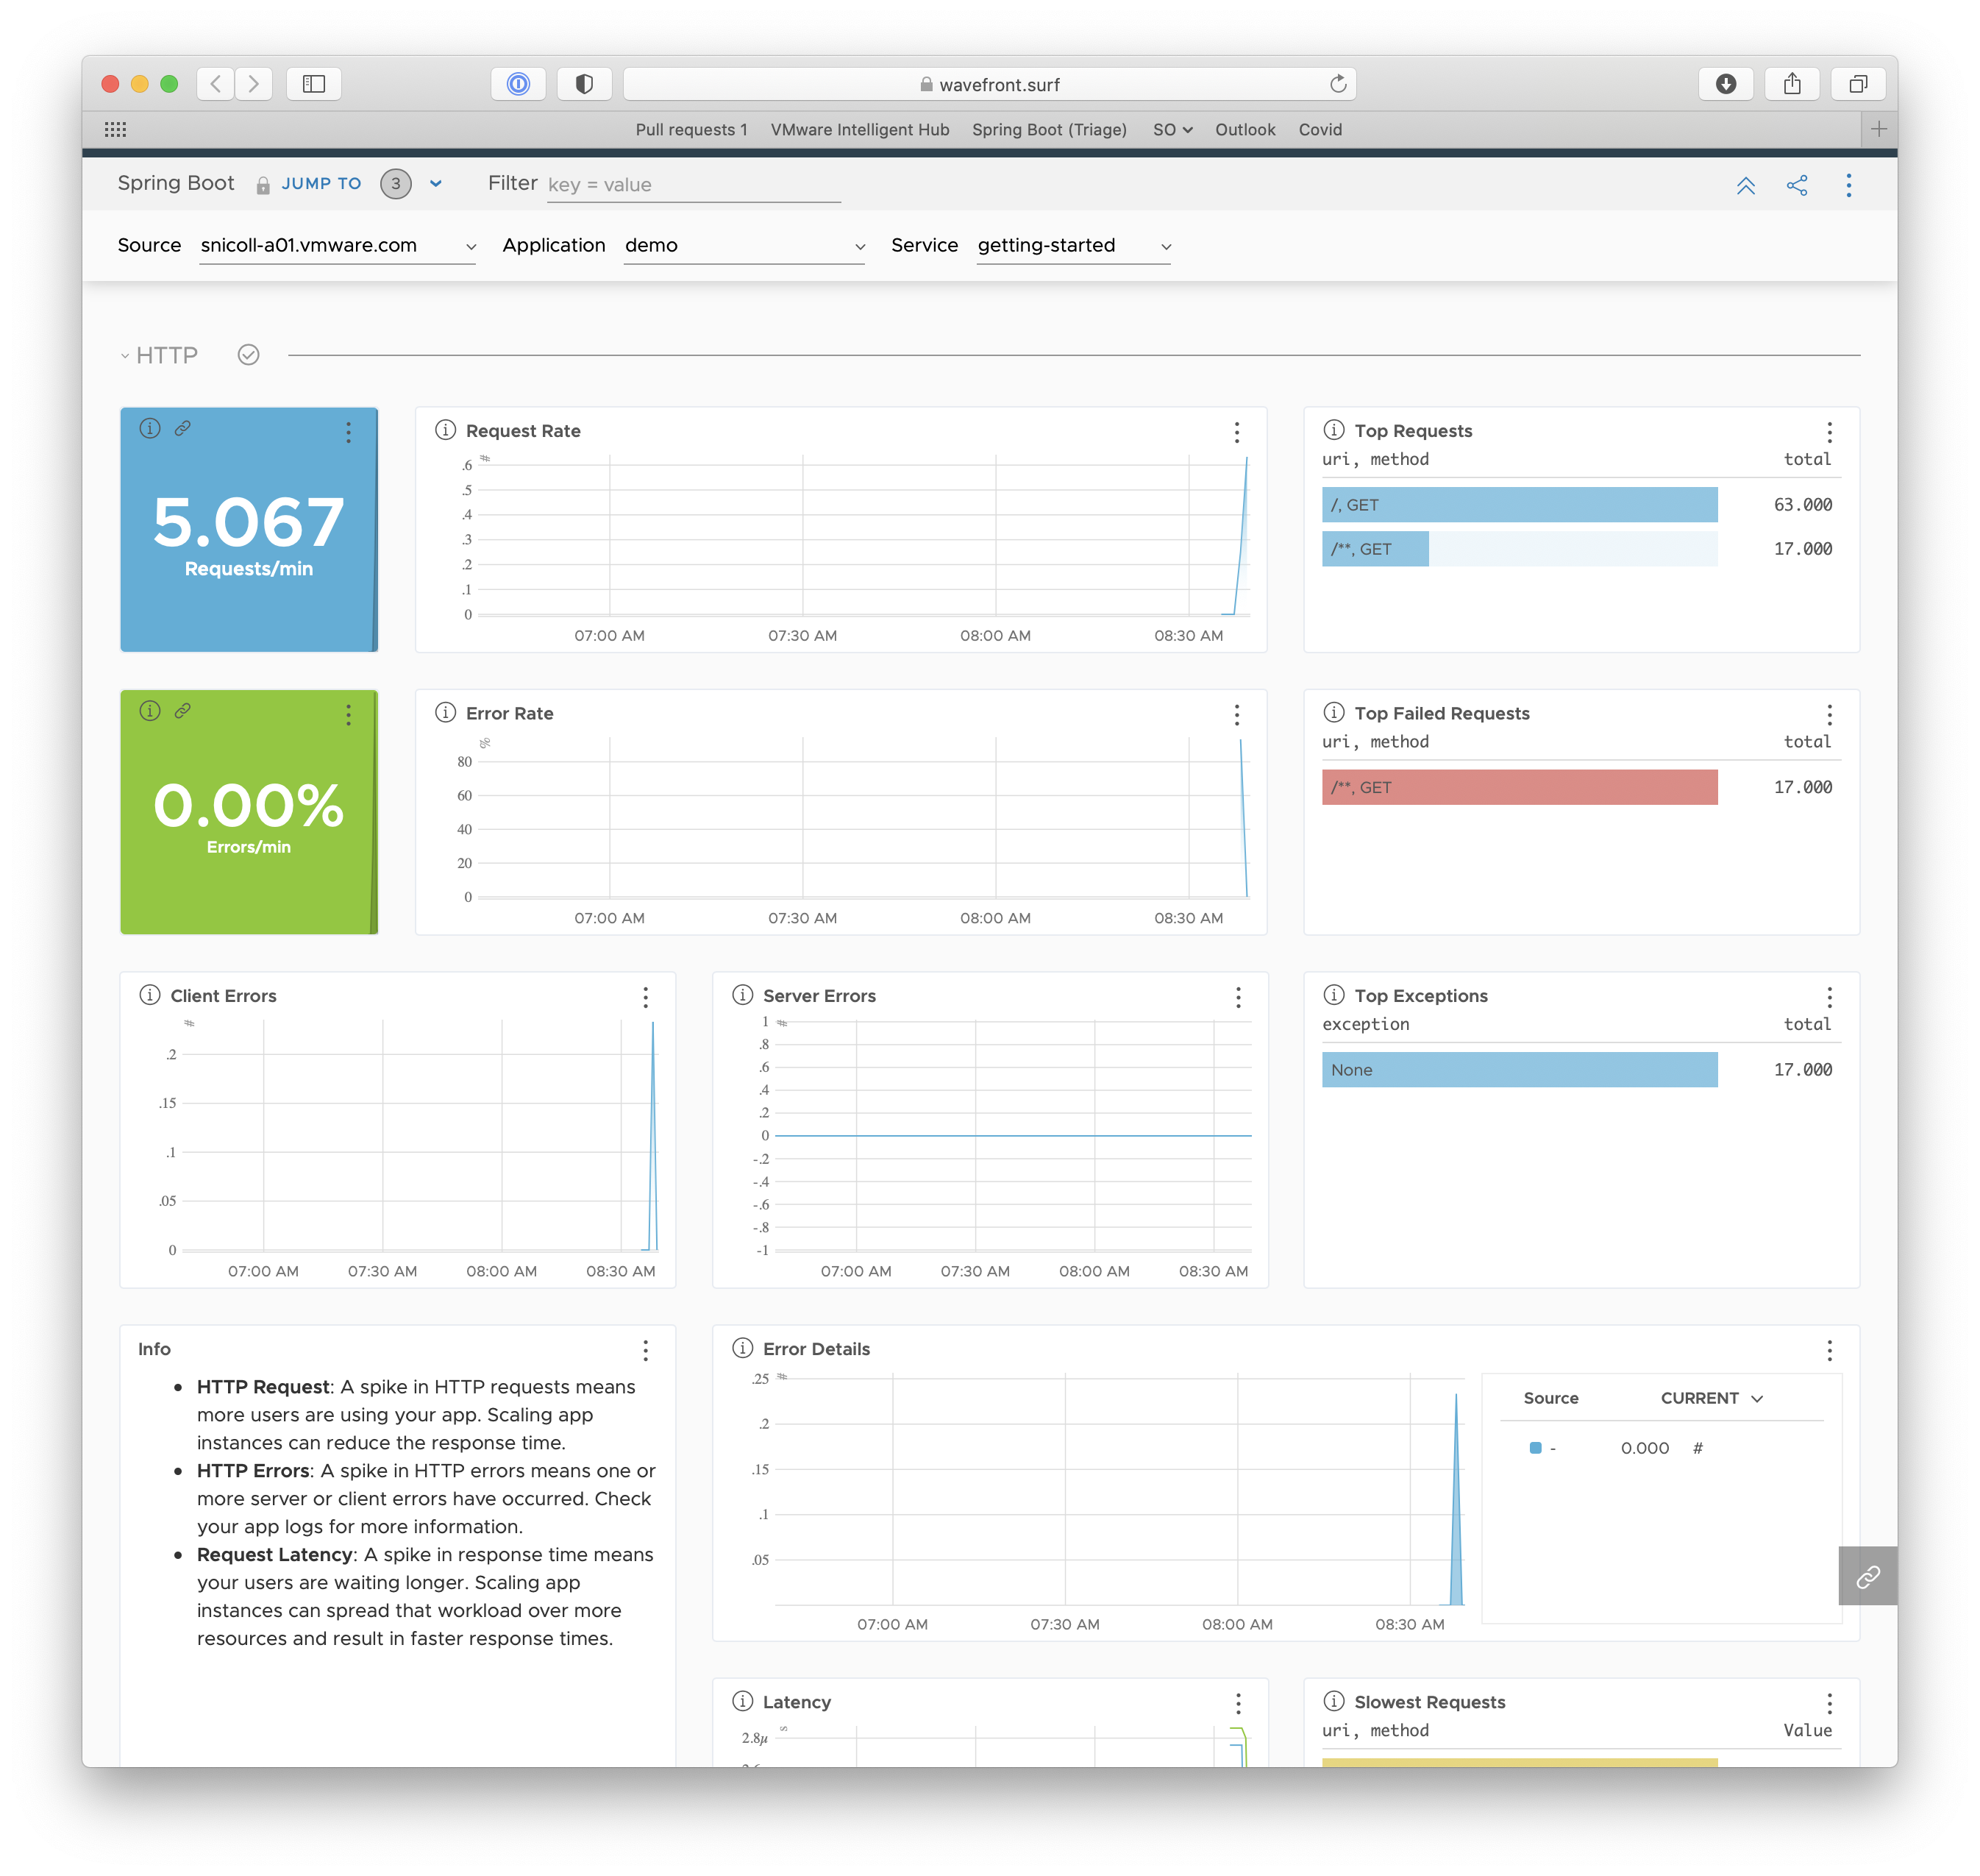
You’ll notice an extra HTTP section on the dashboard. This feature is called conditional dashboards and lets you display sections according to a filter.
-
Optionally, access
http://localhost:8080/does-not-existto trigger a client-side 404 error.
Congratulations! You just developed a web application that sends metrics to Tanzu Observability by Wavefront.
The following may also be helpful:
-
Wavefront for Spring Boot 3 README, which includes instructions for enabling Distributed Tracing
-
Tanzu Observability by Wavefront for Spring Boot Documentation


