AOSDV is an acronym for Advanced Orientation Simulator and Data Visualizer. As the name suggests, it is a tool for simulation of orientation of an object (euler’s angles and quaternions), its physical state (temperature, pressure etc.) and other data as per required. In addition to simulation, different data can also be visualized using graphs and tables remotely as well as locally. This tool was developed as a requirement for fulfillment of final practical examinations of Database Management System.
The main objective behind development of this tool is to facilitate scientists and engineers to build complex projects by allowing them to precisely simulate orientation of objects in the three dimensional space in the bargain allowing them to visualize different data using graphs. Initial version of this tool [1] could only be run locally on a single device but the pandemic has taught us how difficult it can be for many people to collaborate on a single project without having a proper tool to communicate effectively. This tool was further enhanced to bridge that gap by introducing remote streaming and reading of data using a server. Server maintains a well managed database of data sent by streamer which can be viewed by the reader with permission.
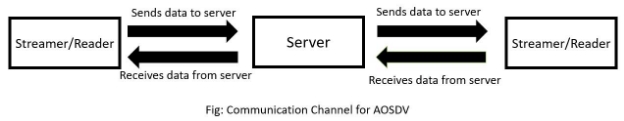
The figure above shows the communication channel used in our tool. It is clear from the figure that any device can stream as well as read and process data as long as they have proper permission. A device can be a streamer as well as a reader. The diagram simply signifies the two way nature of communication.
After fetching the data from a remote object or server, it can be visualized in two ways namely a lined scatter plot and a 3D representation. Scatter plot can be used to analyze change in physical parameters of the object while 3D representation simulates orientation of the given object in 3D space. The data also can be saved locally or in the server as shown in figure above as required.
This is an overview of AOSDV. All about the said tool is explained thoroughly in this paper.
-
We used prototyping model for developing this particular project. First, we developed a simple orientation simulator in C++ back in 2019. We redesigned it in python and added an important data visualization feature giving birth to the Orientation Simulator and Data Visualizer. We then took it a step further to include databases stored on a remote server fabricating AOSDV as we know today.

Fig: Timeline of Development of Project
The methodologies used for developing this particular project are further discussed henceforth.
-
Let us first look at the basic architecture of AOSDV and understand how we implemented different functionalities as well as how they can be used. The architecture is based on communication between client and server. Serial port communication is added for fetching data from remote objects. Block diagram for this is given below and its components are explained as well.
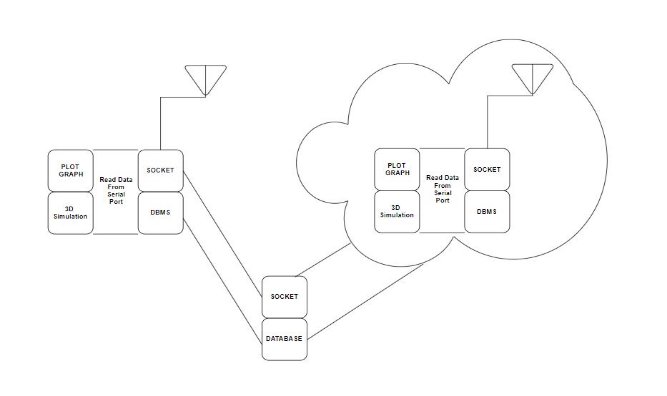
Fig:Basic architecture of AOSDV
-
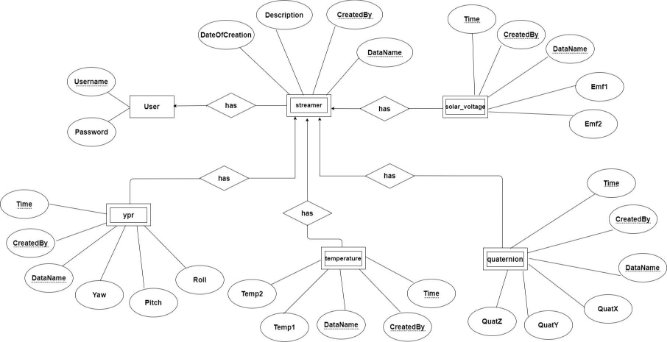
Fig: Entity Relationship diagram of Databas

Fig: Relational diagram of Database
Our database consists of Six tables. But all of the users have access to only five of them except the “user” table. The “password” column in the user table consists of SHA256 hashed passwords.
The “streamer” table consists of a “DateOfCreation” column which consists of a timestamp. The time is synchronized with the server computer time which is (GMT+5:45) .
We have given only SELECT and INSERT privileges to the users currently. Any other queries can be performed only by the root user.
-
A socket program runs on both client and server. Socket program on the server side first
recognizes if the user is streamer or reader. Then it receives the data from the streamer and then broadcasts all the received data to all the reader clients.
Fig: Communication channel for AOSDV
The socket program on the client side handles sending and receiving of the data to or from the single server. The address of the server and the port for the communication is read from the config.txt[2] file.
-
This part of the program receives data from the Serial port. It first fetches the portname and baud rate from the config.txt[2] file and then it starts reading the corresponding serial port.
-
3D simulation is done with the help of Panda3D. It first shows the user a frame to select their model.
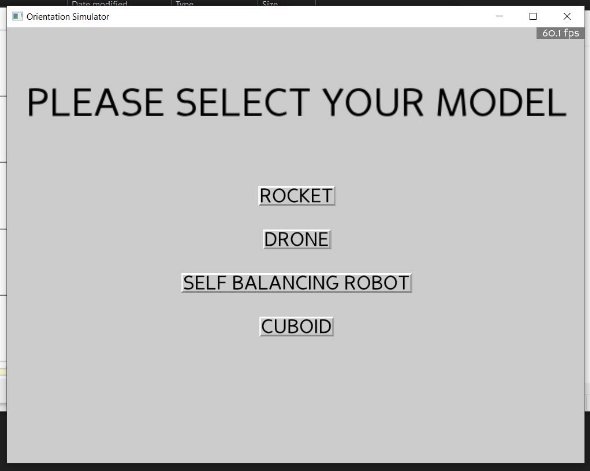
Fig: Selecting Model
After the model is selected it simulates the model in real time as per the yaw, pitch and roll data.

Fig: Rocket Model
-
Plot Graph is completely designed with matplotlib (version 13.2.1 or 13.2.2). We have made use of different buttons, widgets, sliders, labels to make users work on the graph more efficiently.

Fig: Plot Graph
-
-
It saves data to the database. The program takes server ip address, Username, Password from the config.txt file and then establishes a connection with the mysql server and then uploads the currently plotted data to the database with the Username, DataName, and description from the config.txt file.
-
This button saves the data locally.
-
This button clears the figure.
-
It stops the animation.
-
It starts the animation.
-
The blue color slider can be used to control the data congestion in the figure.
-
The labels on the top right corner can be used to toggle the view.
-
The minor grid button on the top right corner can be used to toggle the minor grids view.
If you have cloned the project from the github repository you can open the project by running aosdv_run.bat file. After that the config.txt[2] file opens for changing the configurations realtime and along with that the user is asked to select one of the five modes as below.
 Fig: Selection of modes
-
-
-
In this mode of operation, the user is not connected to any Mysql server or socket server. This mode reads data from the serial port and visualizes the data.
-
In this mode of operation the program fetches data from the database and visualizes it. The program first fetches the server address, username, password from the config.txt file and establishes connection. After that the server fetches data from the database with the given data name from the config.txt file.
-
In this mode the user receives the data from the server real time and then the received data is plotted.
-
In this mode, the user reads the data from the serial port and visualizes it. Along with that it sends the data to the server which is then broadcasted to the all the receiver. In this mode, the user also has access to the database so, the user can save the data to the database as well.
-
This mode is similar to mode 4 except that in this mode the user does not have access to the data
-
-
In this section, the procedure of testing the product is explained in detail. You can clone the project from the github repository if you wish to follow along. The procedure is as follows:
-
Create a python virtual environment “aosdv-venv” inside your local repository and install the below packages..
Matplotlib ------- version 3.2.1 or 3.2.2
Panda3D
mysql -connector
serial
-
Run the aosdv_run.bat file.
-
Change the config.txt file as per your requirements and save the file.
-
Choose the mode as per your requirement.
On the server side
- Create the database as described above in the database section.
- Run the server.py file.
[2]Config.txt
{"Host": "<ipv6 or ipv4 address of the server", "Port": <port number>,

"User": "<Username>",

"Password": "<Password>",

"Database": "<database name>",

"Portname": “<port name>",

"Baudrate": "<baud rate>",

"DataName" : "<data name>",

"Description" : "<description about the data>" }
Therefore, Advanced Orientation Simulator & Data Visualizer is built and tested. We are successful in fetching data from a remote object mounted with IMU, displaying it in a computer, streaming it to another computer, storing it in a database in the server and also saving it locally. We are able to plot 100’s of data a second. 3D orientation simulation of a remote object is also done with negligible inaccuracy.
The minimum viable product is ready with a lot of optimizations and improvements to be made in future. The main problems we encountered during experimentation were as follows :-
- Frequency of data plotting is still not high enough which ultimately limits usability of the tool.
- Due to some bug, the server freezes if certain unexpected activity occurs on the client side.
Our aim to improve these problems in future is further discussed in future scope.
The prospect of expansion in this project is limitless. But first, our immediate plan in the near future is to rectify the shortcomings in this particular version. One of such problems is inefficiency of server-client communication which results in freezing of servers from time to time. Similarly, there are other bugs to be tackled.Also, the data plotting rate needs to be improved. Removing such bugs and limitations and making the software run smoothly is our first immediate plan.
Though removal of bugs and construction of more efficient software would give us a very powerful tool, we also have plans for expansion. This tool could be expanded to include a wide array of data required for specific projects which means the tool can be tailored in accordance to the need of a particular project. Furthermore, various data processing functionalities such as data validation, calculation of parameters, data analysis could be added to aid in machine learning and artificial intelligence application of the tool. This tool could also be enhanced to aid in automation through the mechanism of simulation and data visualization. This software already has a lot of applications in the aerospace industry which could be further expanded by adding functionalities such as real time imaging of spacecraft and satellites.
We also plan to use this tool in our future projects requiring data analysis and 3D orientation simulation.