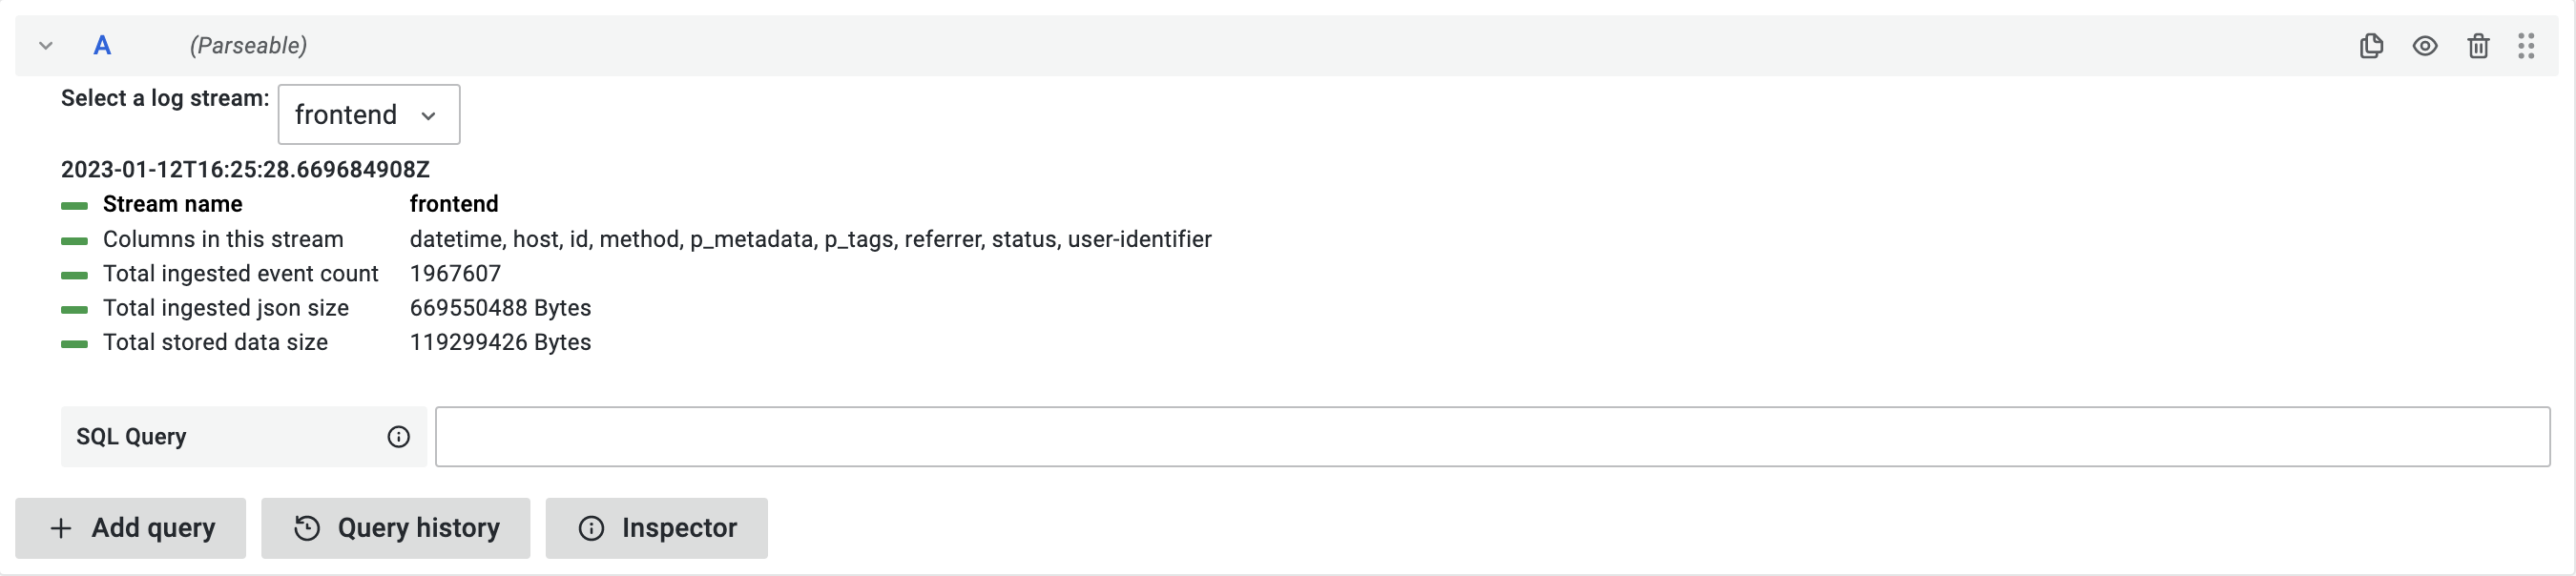
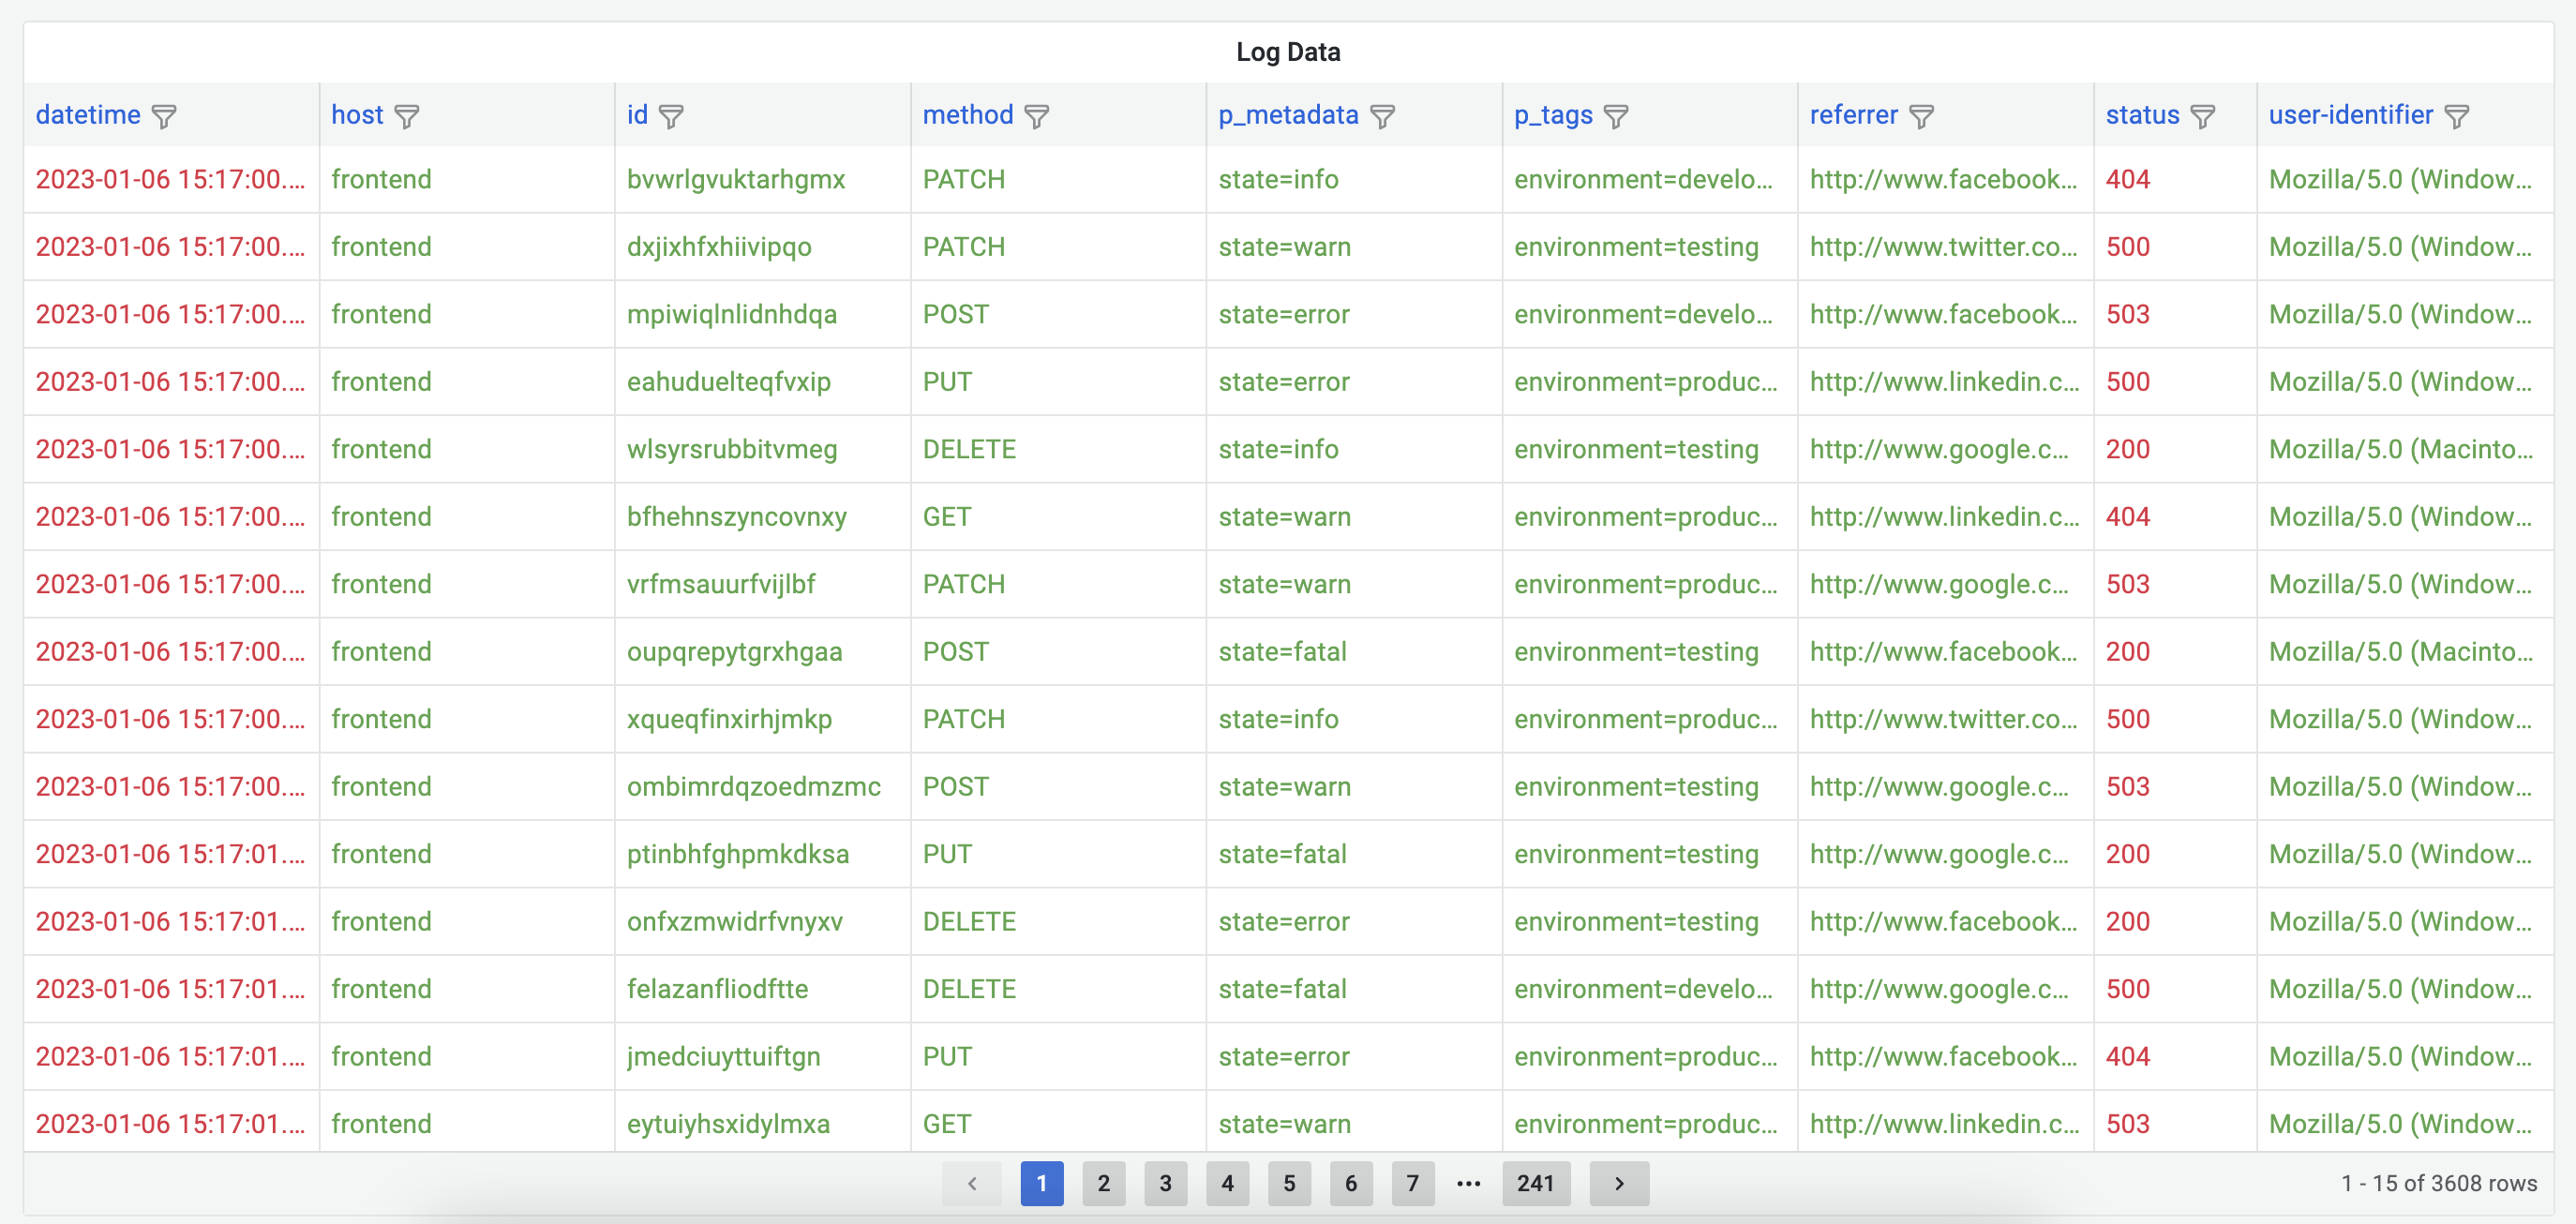
This data source plugin allows you to query and visualize log data stored in Parseable server.
- Parseable server setup and receiving logs from your application. Read more on Parseable documentation.
- Grafana installed and running. Read more on Grafana documentation.
Refer the Parseable Grafana documentation page: https://www.parseable.io/docs/integrations/grafana.
- Download the binary file and install Grafana according to your operating system.
- Open the extracted file >
conf>defaults.ini. - Search for
allow_loading_unsigned_plugins =and replace it with:
allow_loading_unsigned_plugins = parseable-parseable-datasource
- Create a folder called
data> inside it, create a new folder calledplugins. Thedatafolder may already exist in your repository; then, you only need to create thepluginsfolder. - Copy the compressed plugin file containing assets [Parseable datasource plugin zip file] to the
pluginsfolder you created insidedata. - On a terminal, open the
pluginsfolder > run:
unzip parseable-datasource-*.*.*.zip -d ./parseable-parseable-datasource
- Restart the Grafana server to load the manually installed plugin.
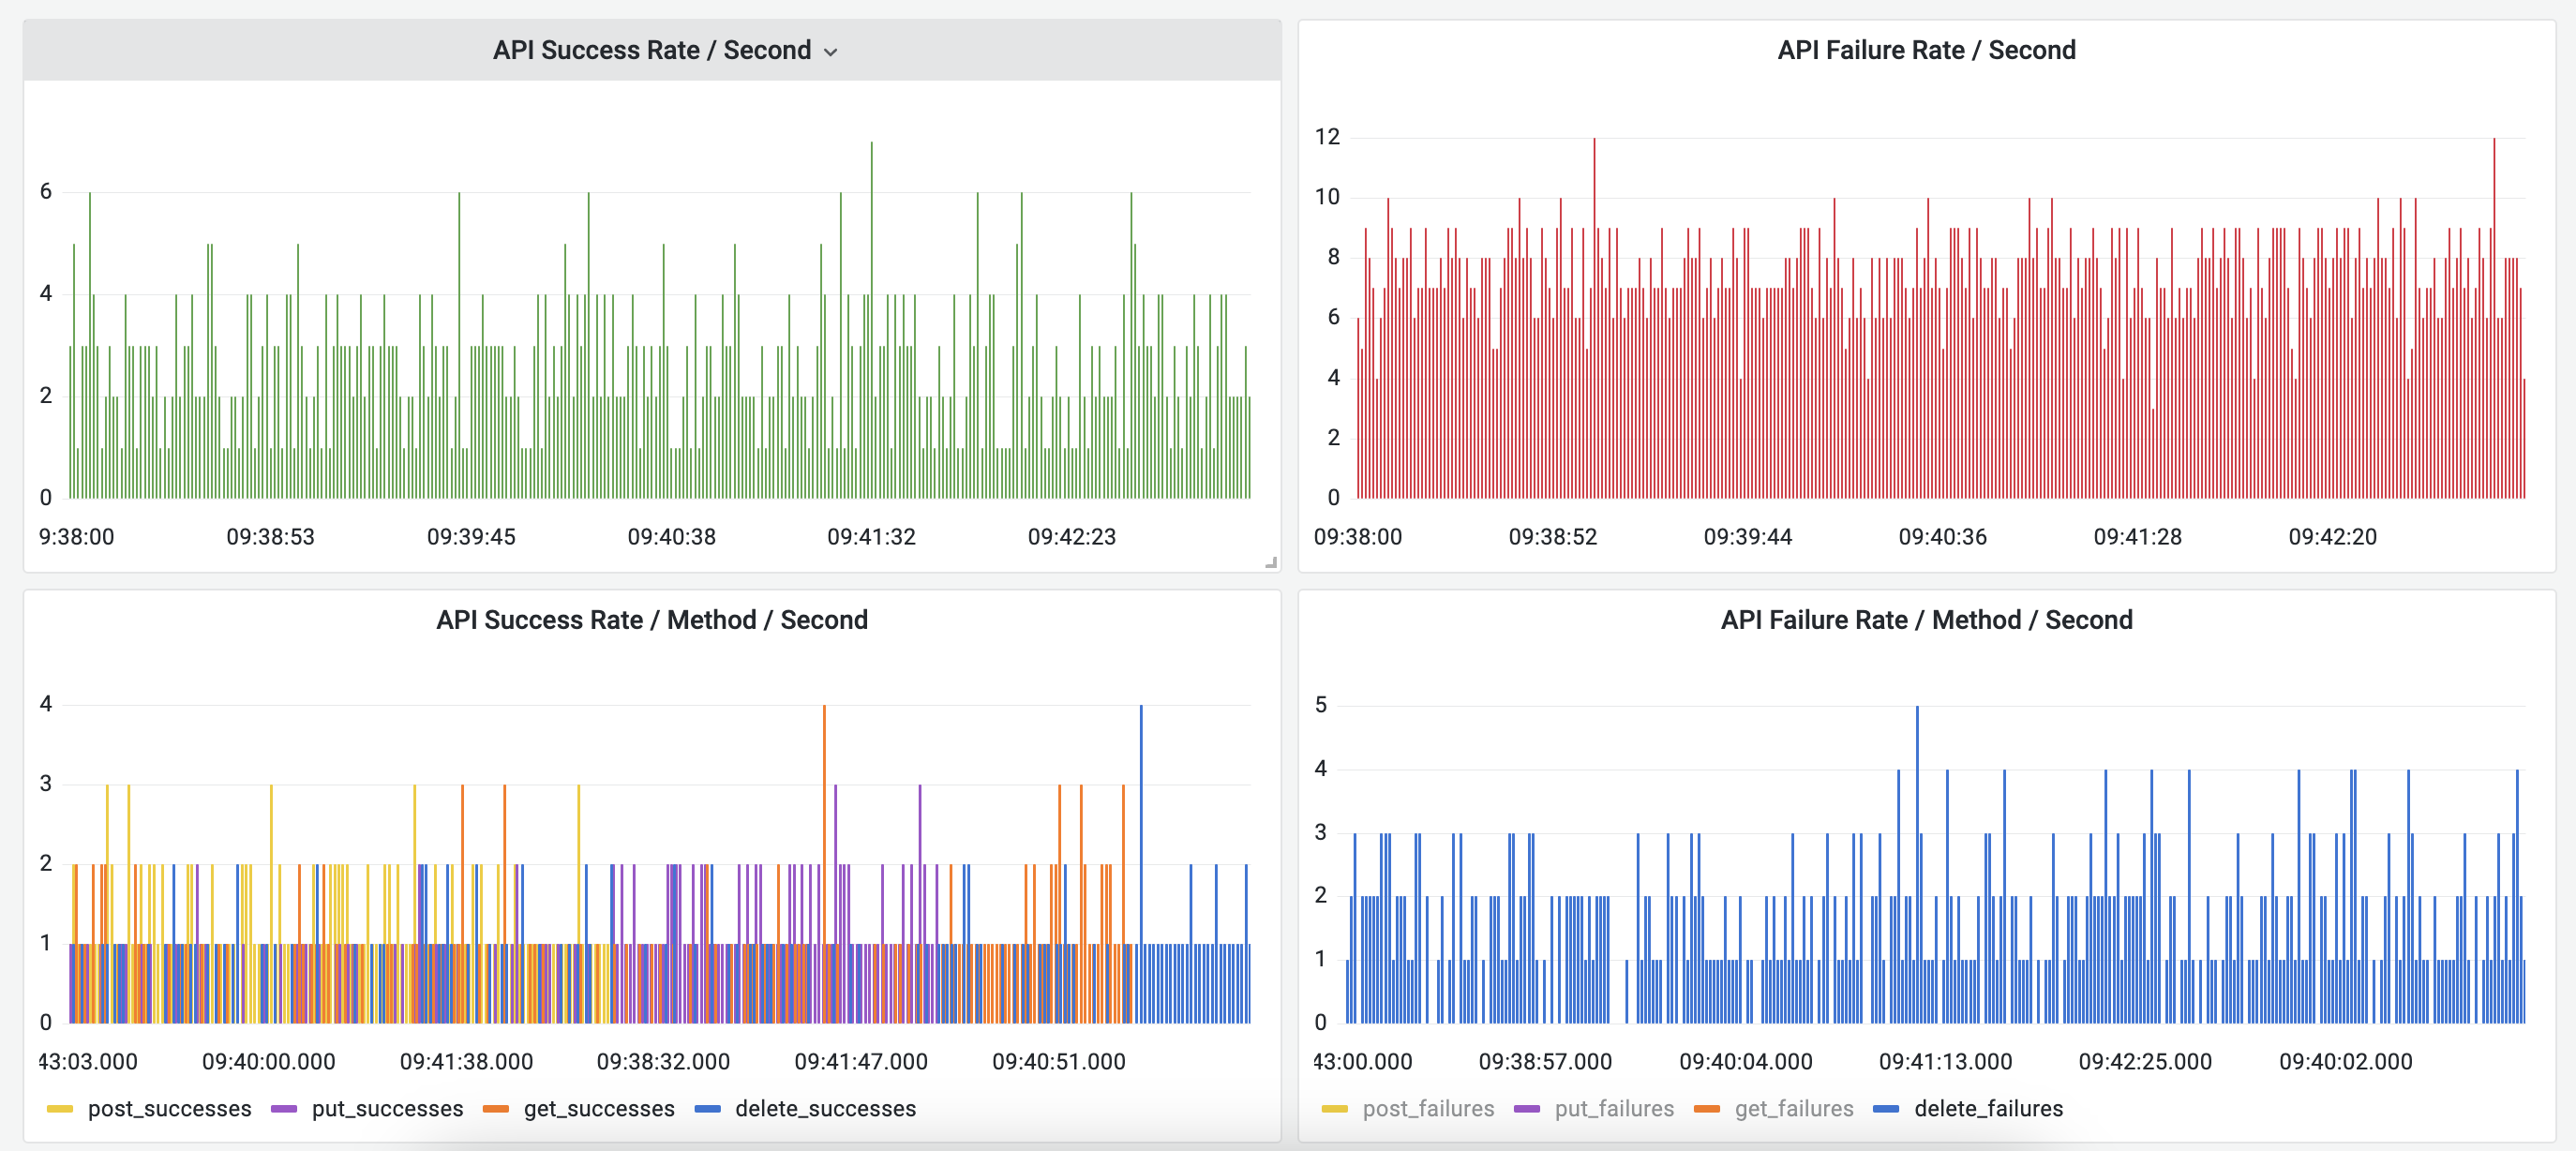
This repository also contains dashboard developed using Parseable datasource plugin as data source. Refer the dashboards directory for more details.
This plugin is developed in collaboration with our friends at Technocube. Thanks to them for their support and contribution.