The growth of social media platforms in conveying the market sentiments presents an opportunity for businesses and social initiatives to make better-informed and accurate decisions. Social networks unearth opinions from relevant communities, predominant notions and popular entities within them. This project details graph analysis of tweets from the Twitter API endpoint.
Table of contents
From contemporary trends and events, The World Cup is chosen as an ideal use case to illustrate the effectiveness and value of this social network analysis. The data was collected on 24th October 2022 (before changes in Twitter API data access tiers) and features 12000 tweets within a span of the previous 7 days. The grouped (world cup) keywords search for a combination of the two words sequentially in a tweet.
The export folder contains the json topic models file and graphs based on interaction types saved in gml formats
Note: Only
pipinstallation is supported.
pip install -r requirements.txt

python app.py
Running the app.py script launches the Dash Plotly dashboard.
The features implemented in this project are illustrated using screenshots of the dashboard.
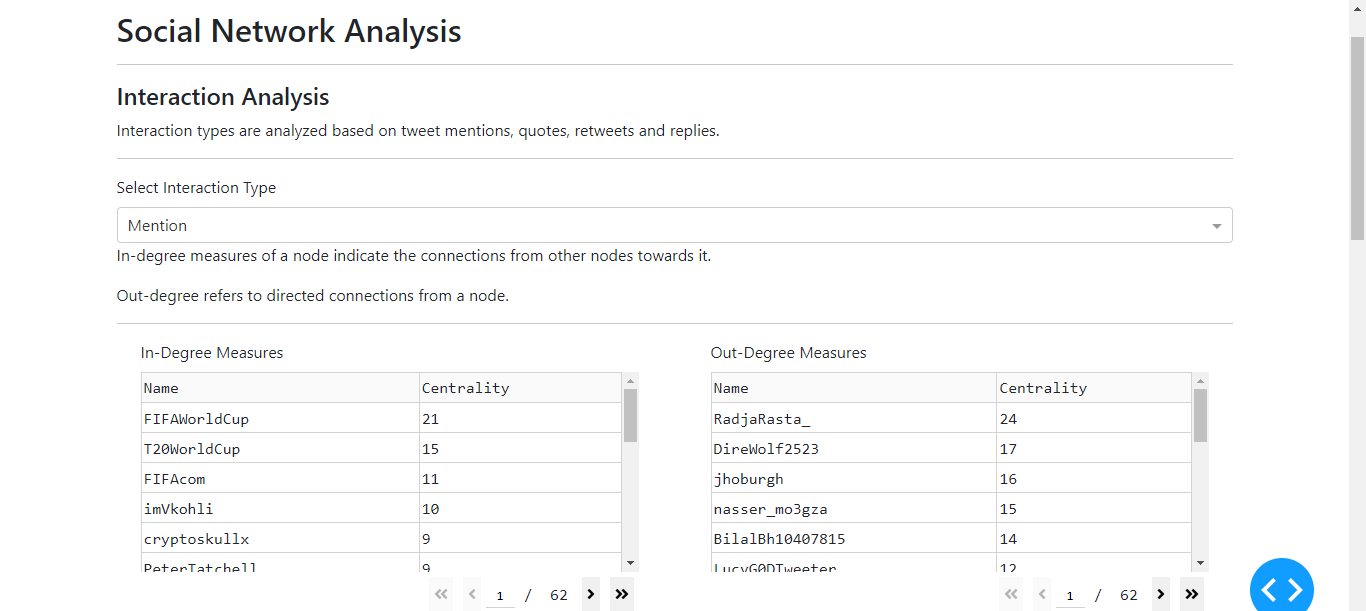
The screenshot showcases the options for visualising interaction types (mentions, quotes, replies and retweets).
It also includes the in-degree and out-degree centrality measures of top nodes in the network.
The network visualization is configured using the desired layout that plots the graph networks based on features such as centrality.
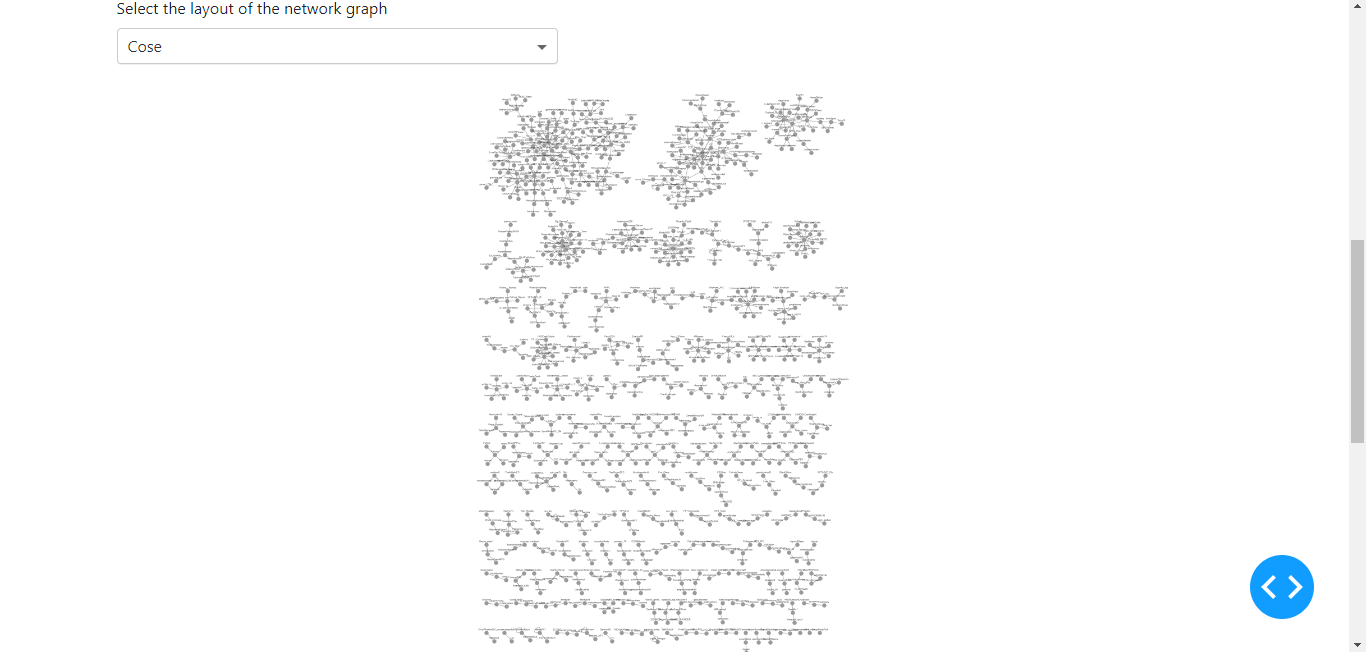
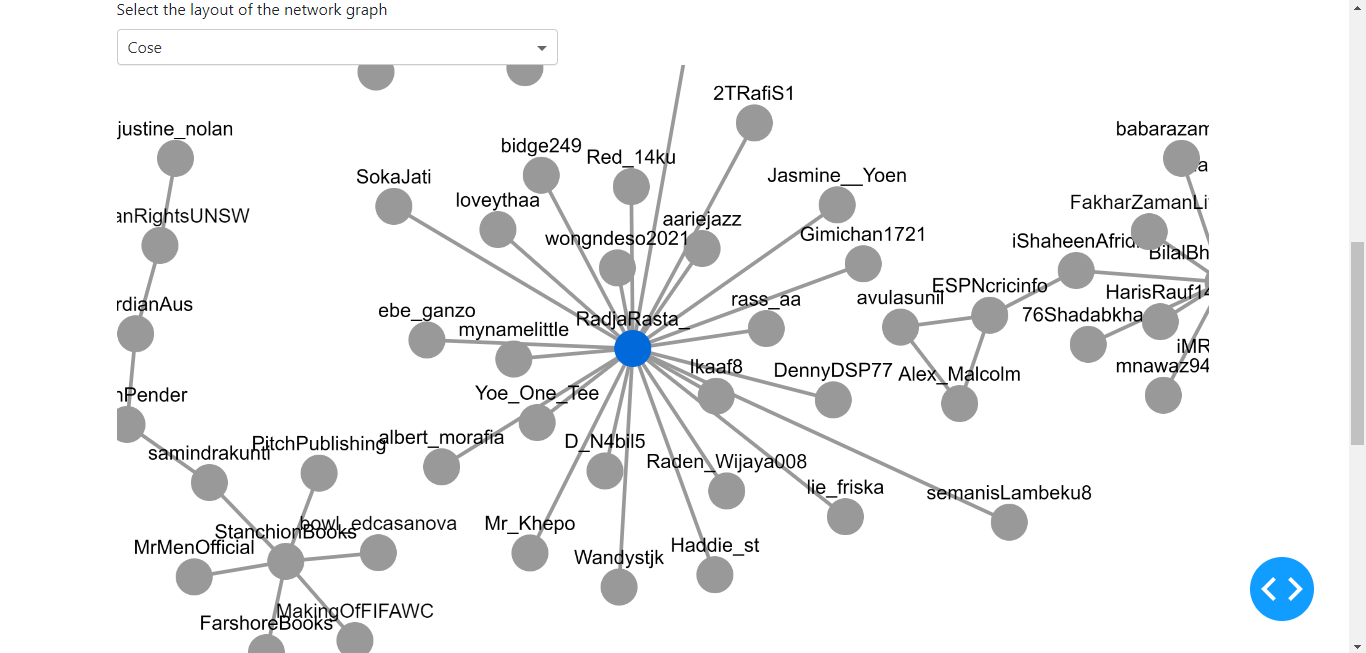
The colour swatches used in presenting the predominant topics in the network are appropriate in distinguishing different entities.
Create graph networks using functions in the networks.py script either using Jupyter Notebook or Streamlit.
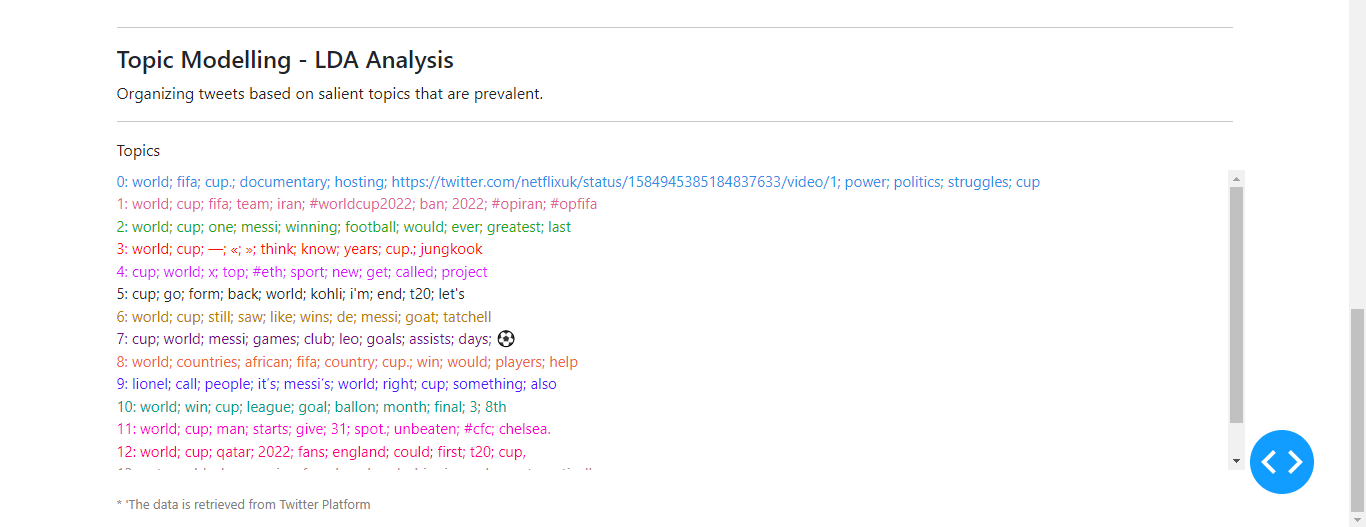
Launch the bertopic.ipynb notebook, install the bertopic library using pip and run the topic modelling algorithm using Transformers.