-
Notifications
You must be signed in to change notification settings - Fork 154
Remotely Debugging the Java Agent Codebase
This document details how to remotely debug the Java agent codebase with IntelliJ IDEA, which is the IDE of choice for developers on the Java agent team. Instructions should be somewhat similar for other IDEs but you will need to refer to their documentation.
This documentation is provided as general guidance for those interested in better understanding the Java agent codebase or actively contributing to the project. The Java agent team cannot directly assist users following this guide but we encourage you to file an issue if any mistakes or points of clarification need to be addressed.
The following requirements must be met before you can remotely debug the Java agent codebase:
- You must clone the Java agent repo.
- You must install a compatible JDK.
- You must install IntelliJ IDEA (the free Community Edition is sufficient).
- You must be able to build the Java agent with gradle.
- You must setup IntelliJ IDEA for the Java agent project.
- You must have a Java agent jar, whether built yourself from source code or downloaded from the officially published versions. Note: If you want to debug one of the officially published versions of the Java agent then you must make sure to also check out the tag for that version (e.g.
git checkout v7.10.0) in the cloned agent repo or else you may encounter a source code mismatch between the jar and repo while debugging. - You must configure the Java agent with a valid license key and app name. This can be done via the agent yaml file, system properties, or environment variable.
This example illustrates how to attach the Java agent to the Spring Boot Pet Clinic application and remotely debug into the agent code as the Pet Clinic application is exercised.
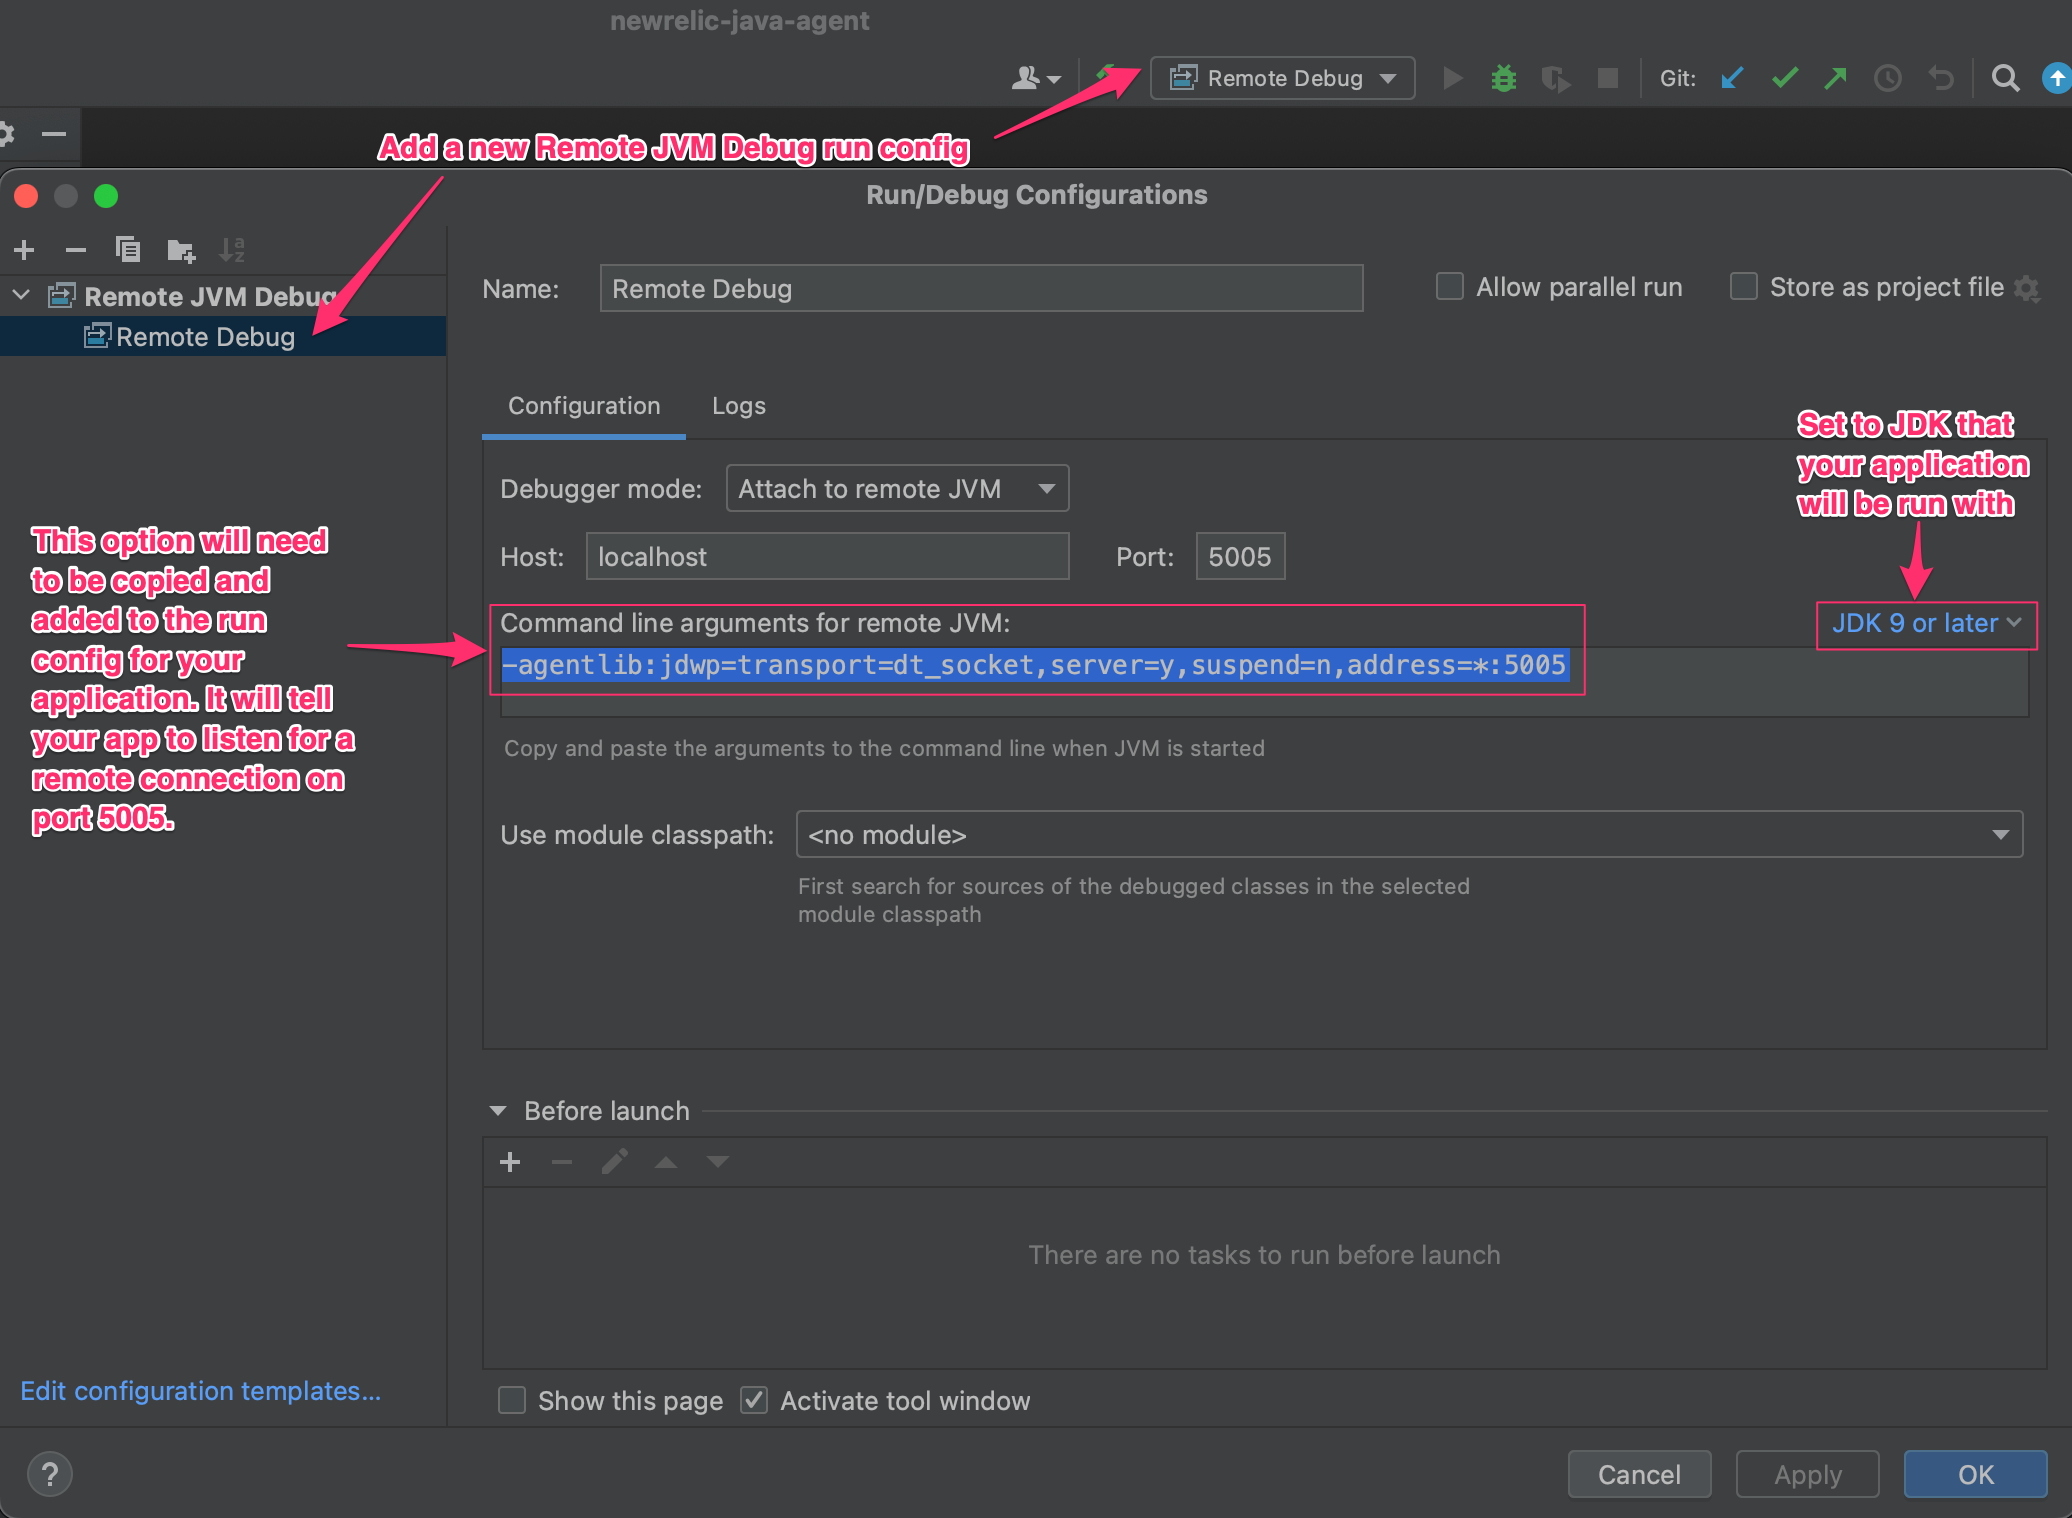
First, create a Remote JVM Debug run configuration for the Java agent project. This will generate a command line argument that any Java application can be started with which will allow the agent project to remotely connect to it.
Note: By default the command line argument specifies suspend=n which means that the application will not wait for another process to remotely connect to it before starting up. If you want to debug early lifecycle agent logic then instead set suspend=y which will prevent your application from starting until the agent's remote debugger has been attached to the process.
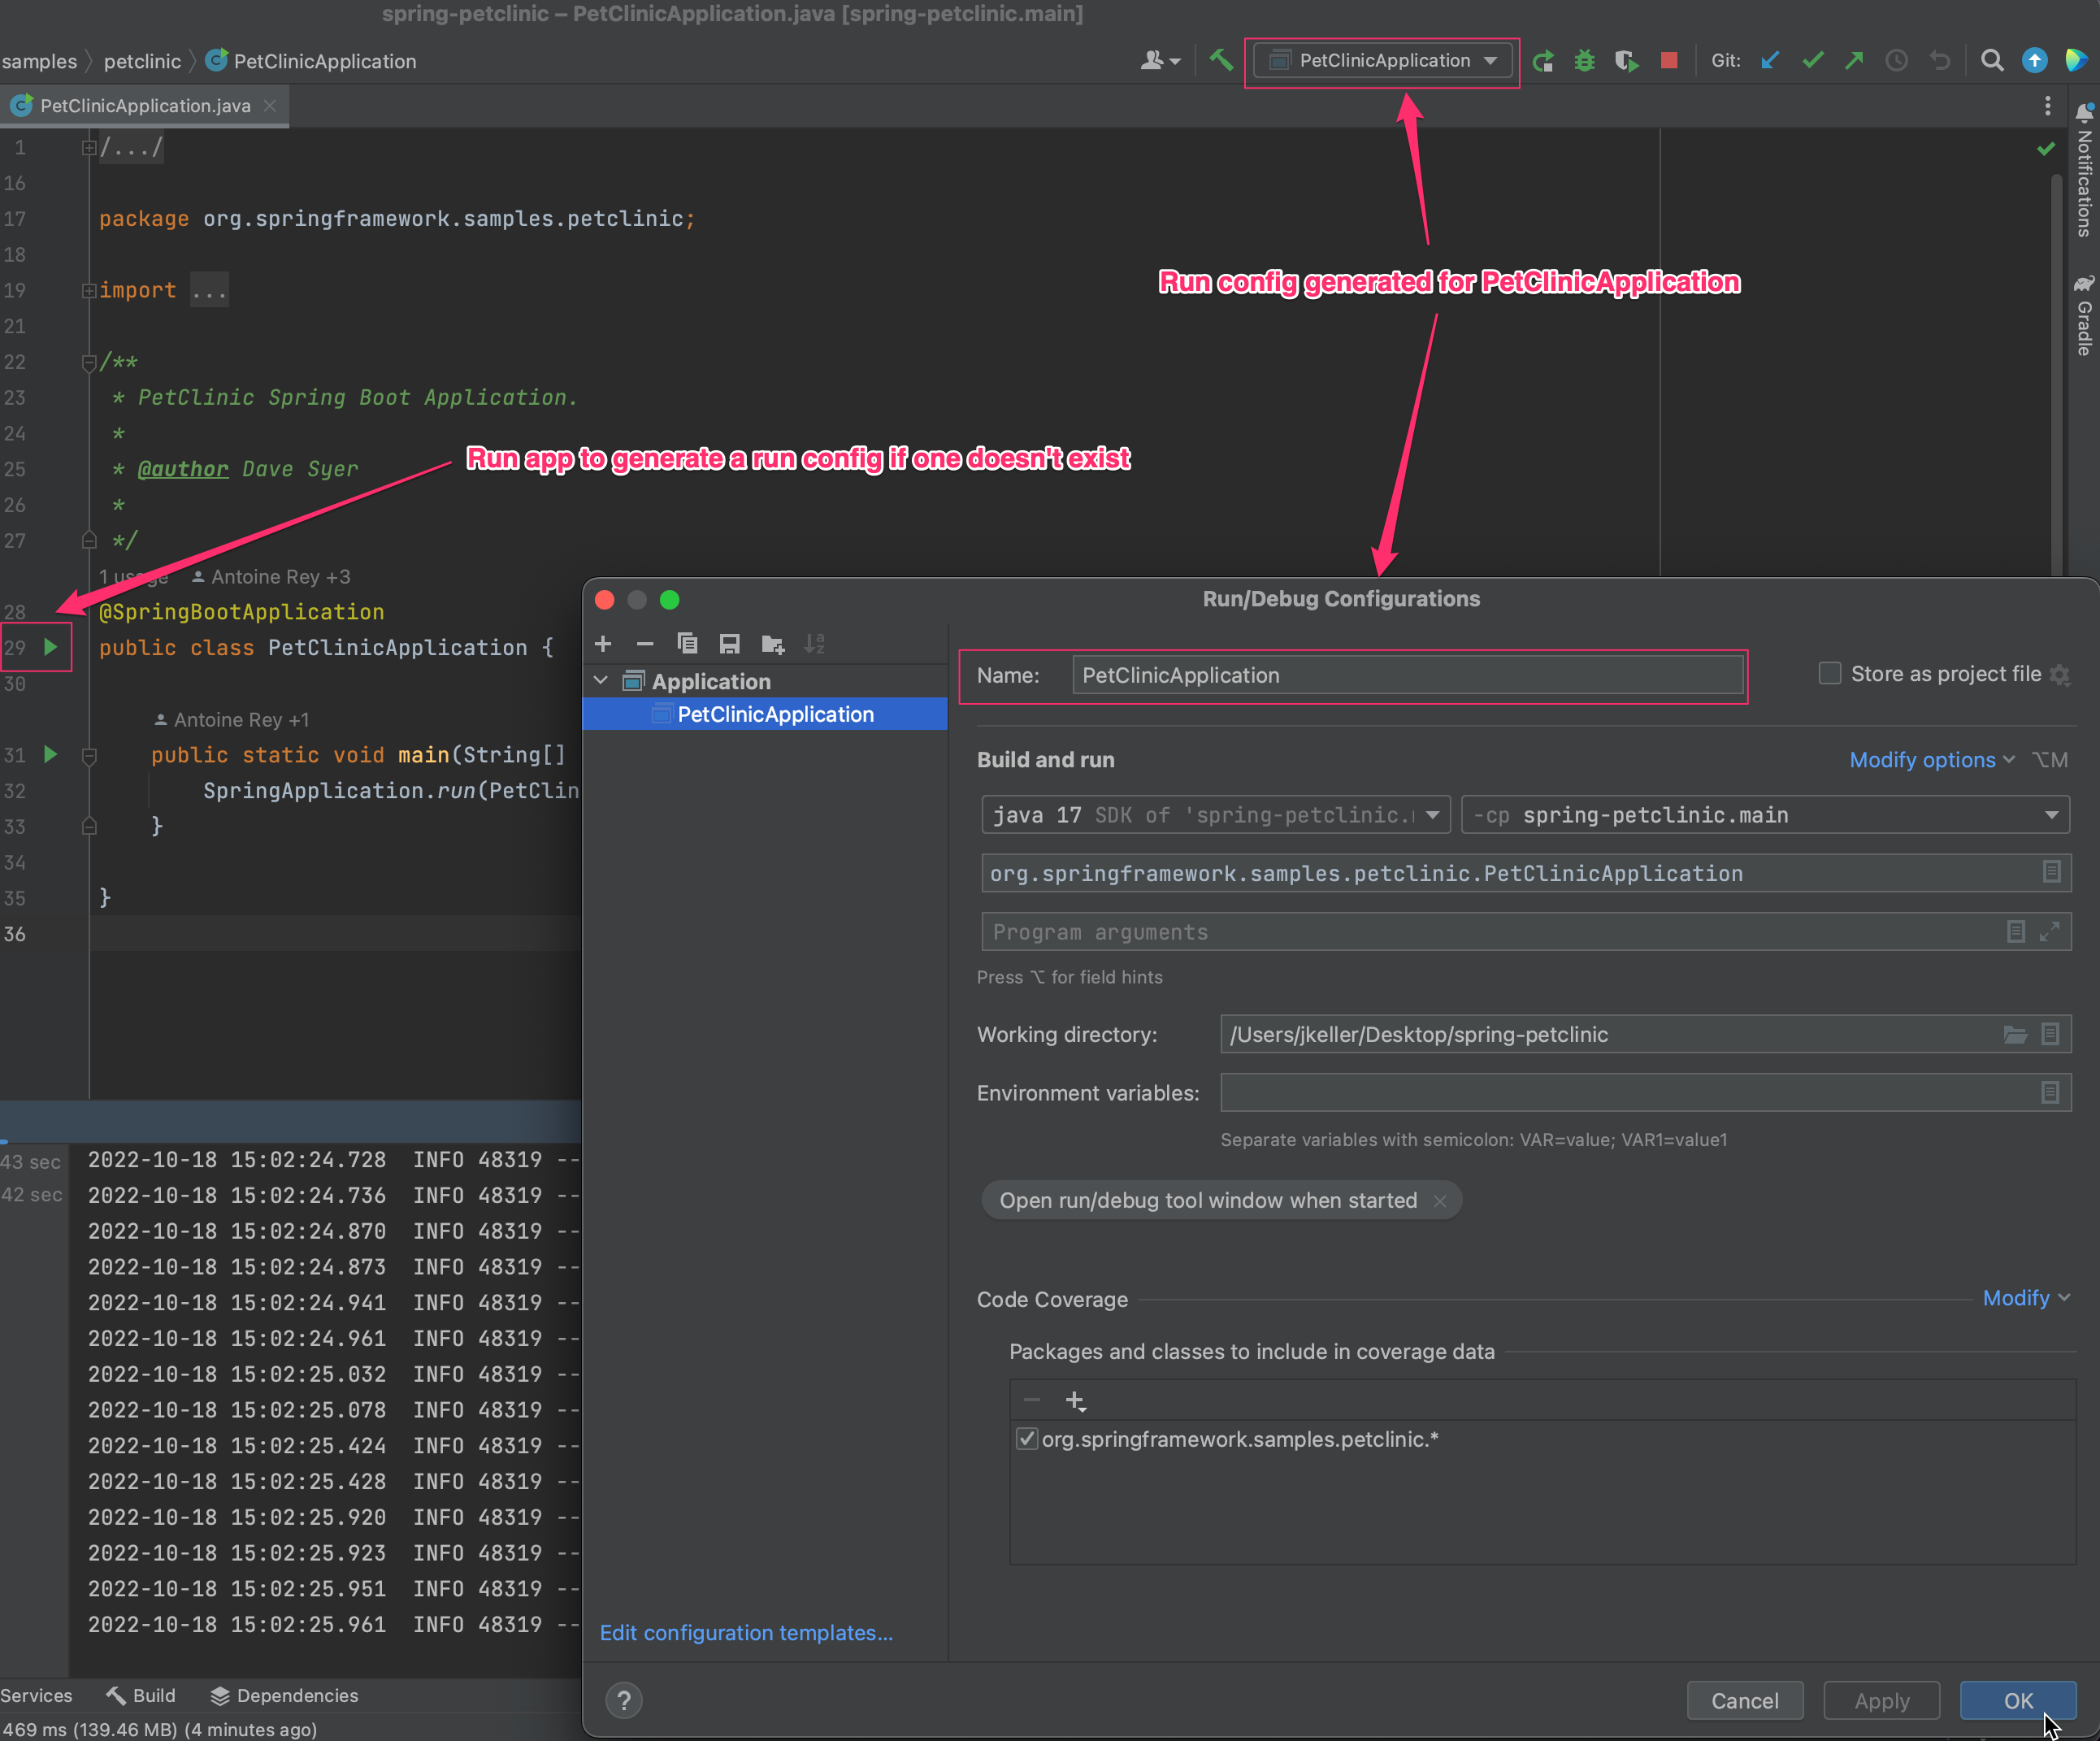
Now, create a run configuration for the Pet Clinic application. If you simply run the application a run config will automatically be created (see screenshot). Alternatively, a run config can be manually created.
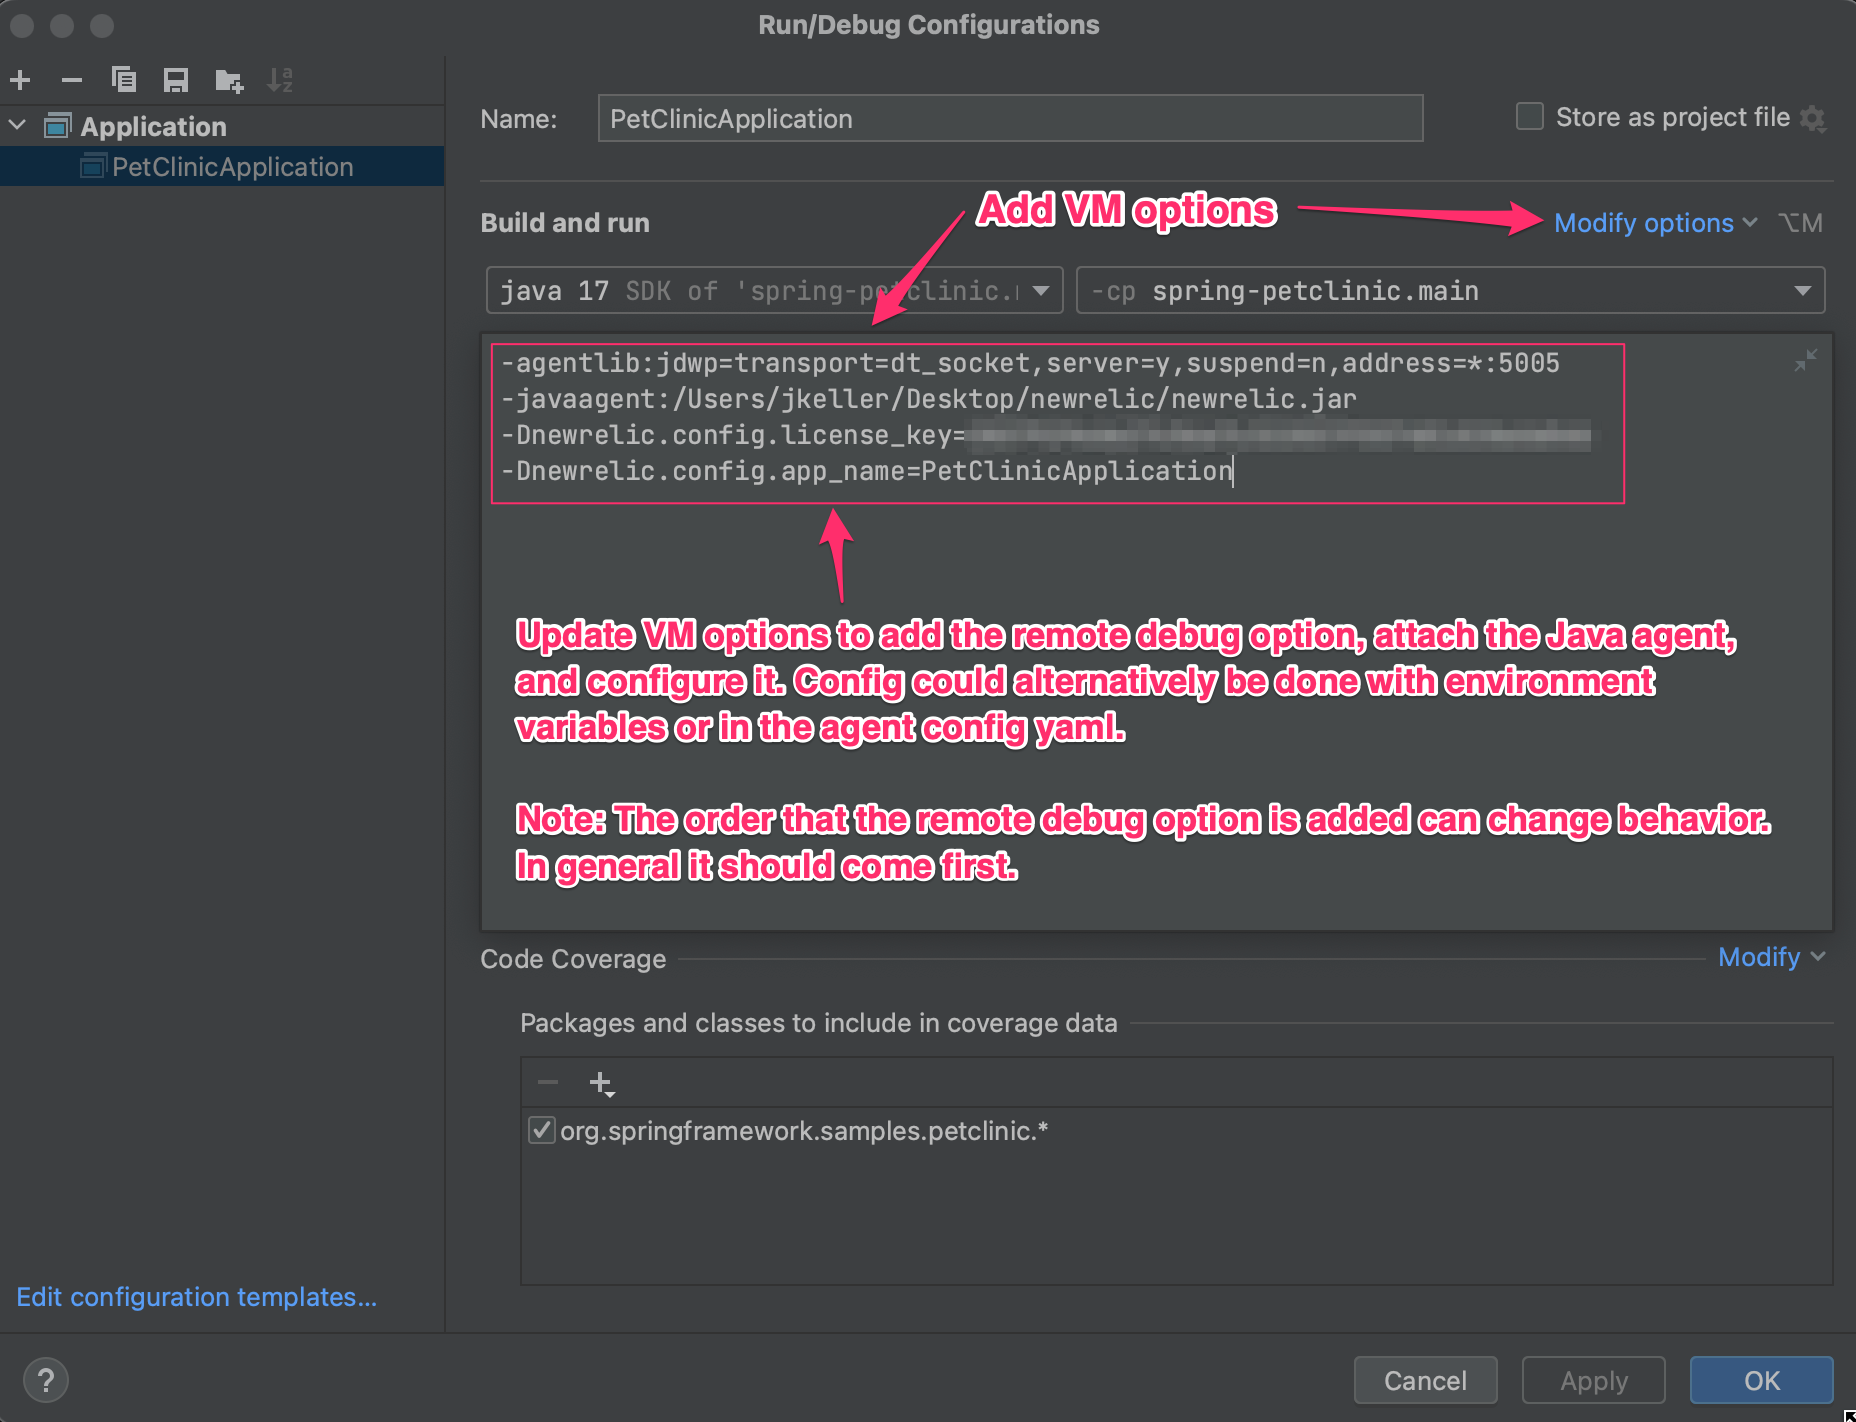
Choose Modify options in the PetClinicApplication run config and select Add VM options. Add the -agentlib remote debug option, the -javaagent option to attach the agent jar, and system properties to configure the agent with a license key and app name (see screenshot).
At this point, everything is ready to start debugging.
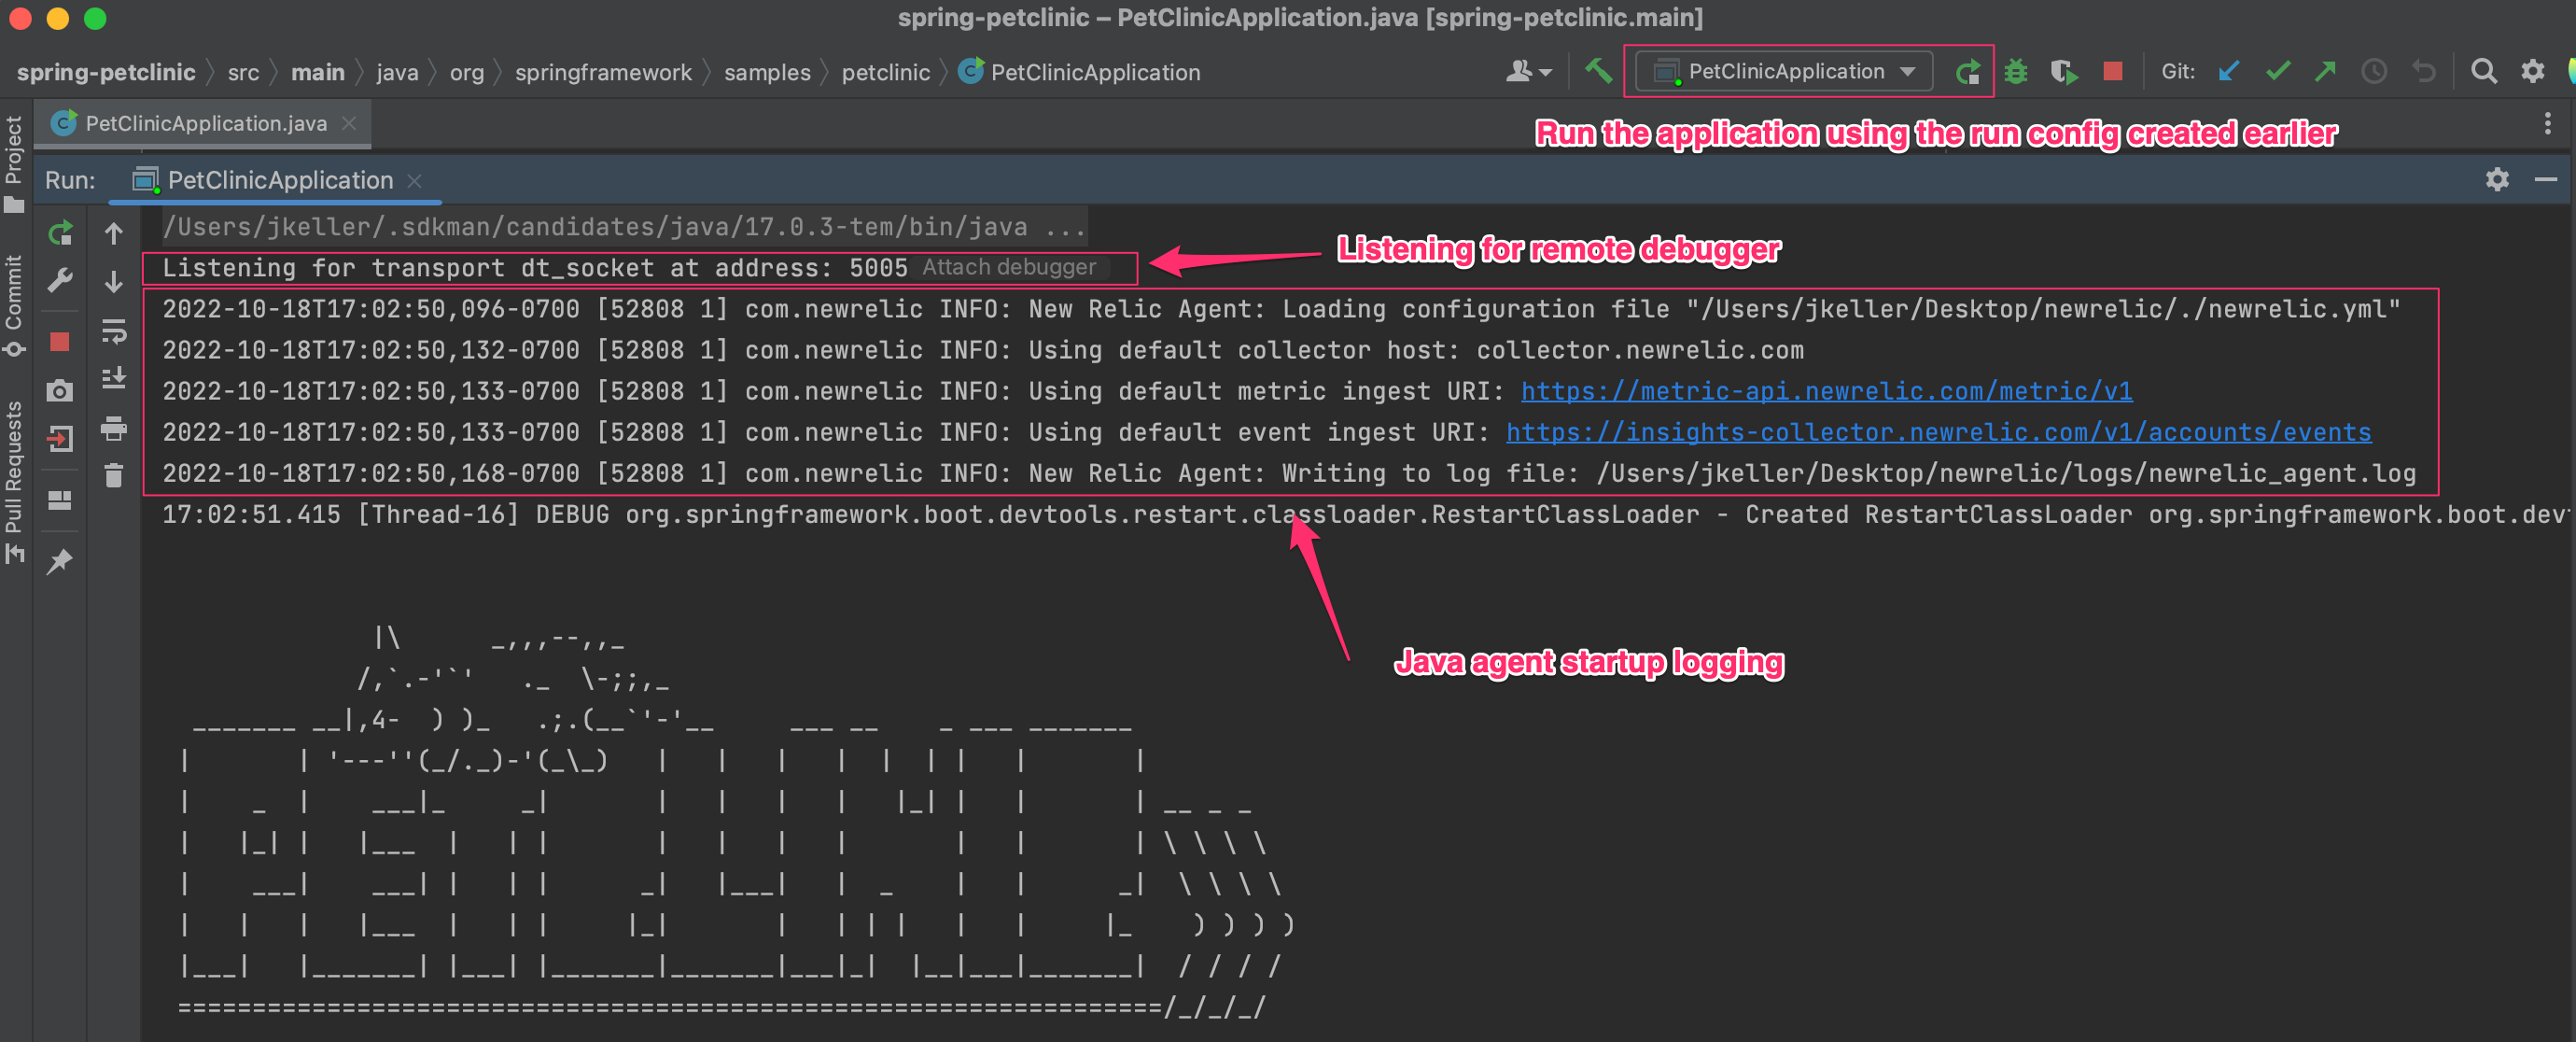
Run the PetClinicApplication application using the run config created earlier. You should see log output indicating that it is listening for a remote debugger to attach as well as startup logging from the Java agent. Note: If you encounter an error stating Cannot load this JVM TI agent twice see the Caveats section below for details on a fix.
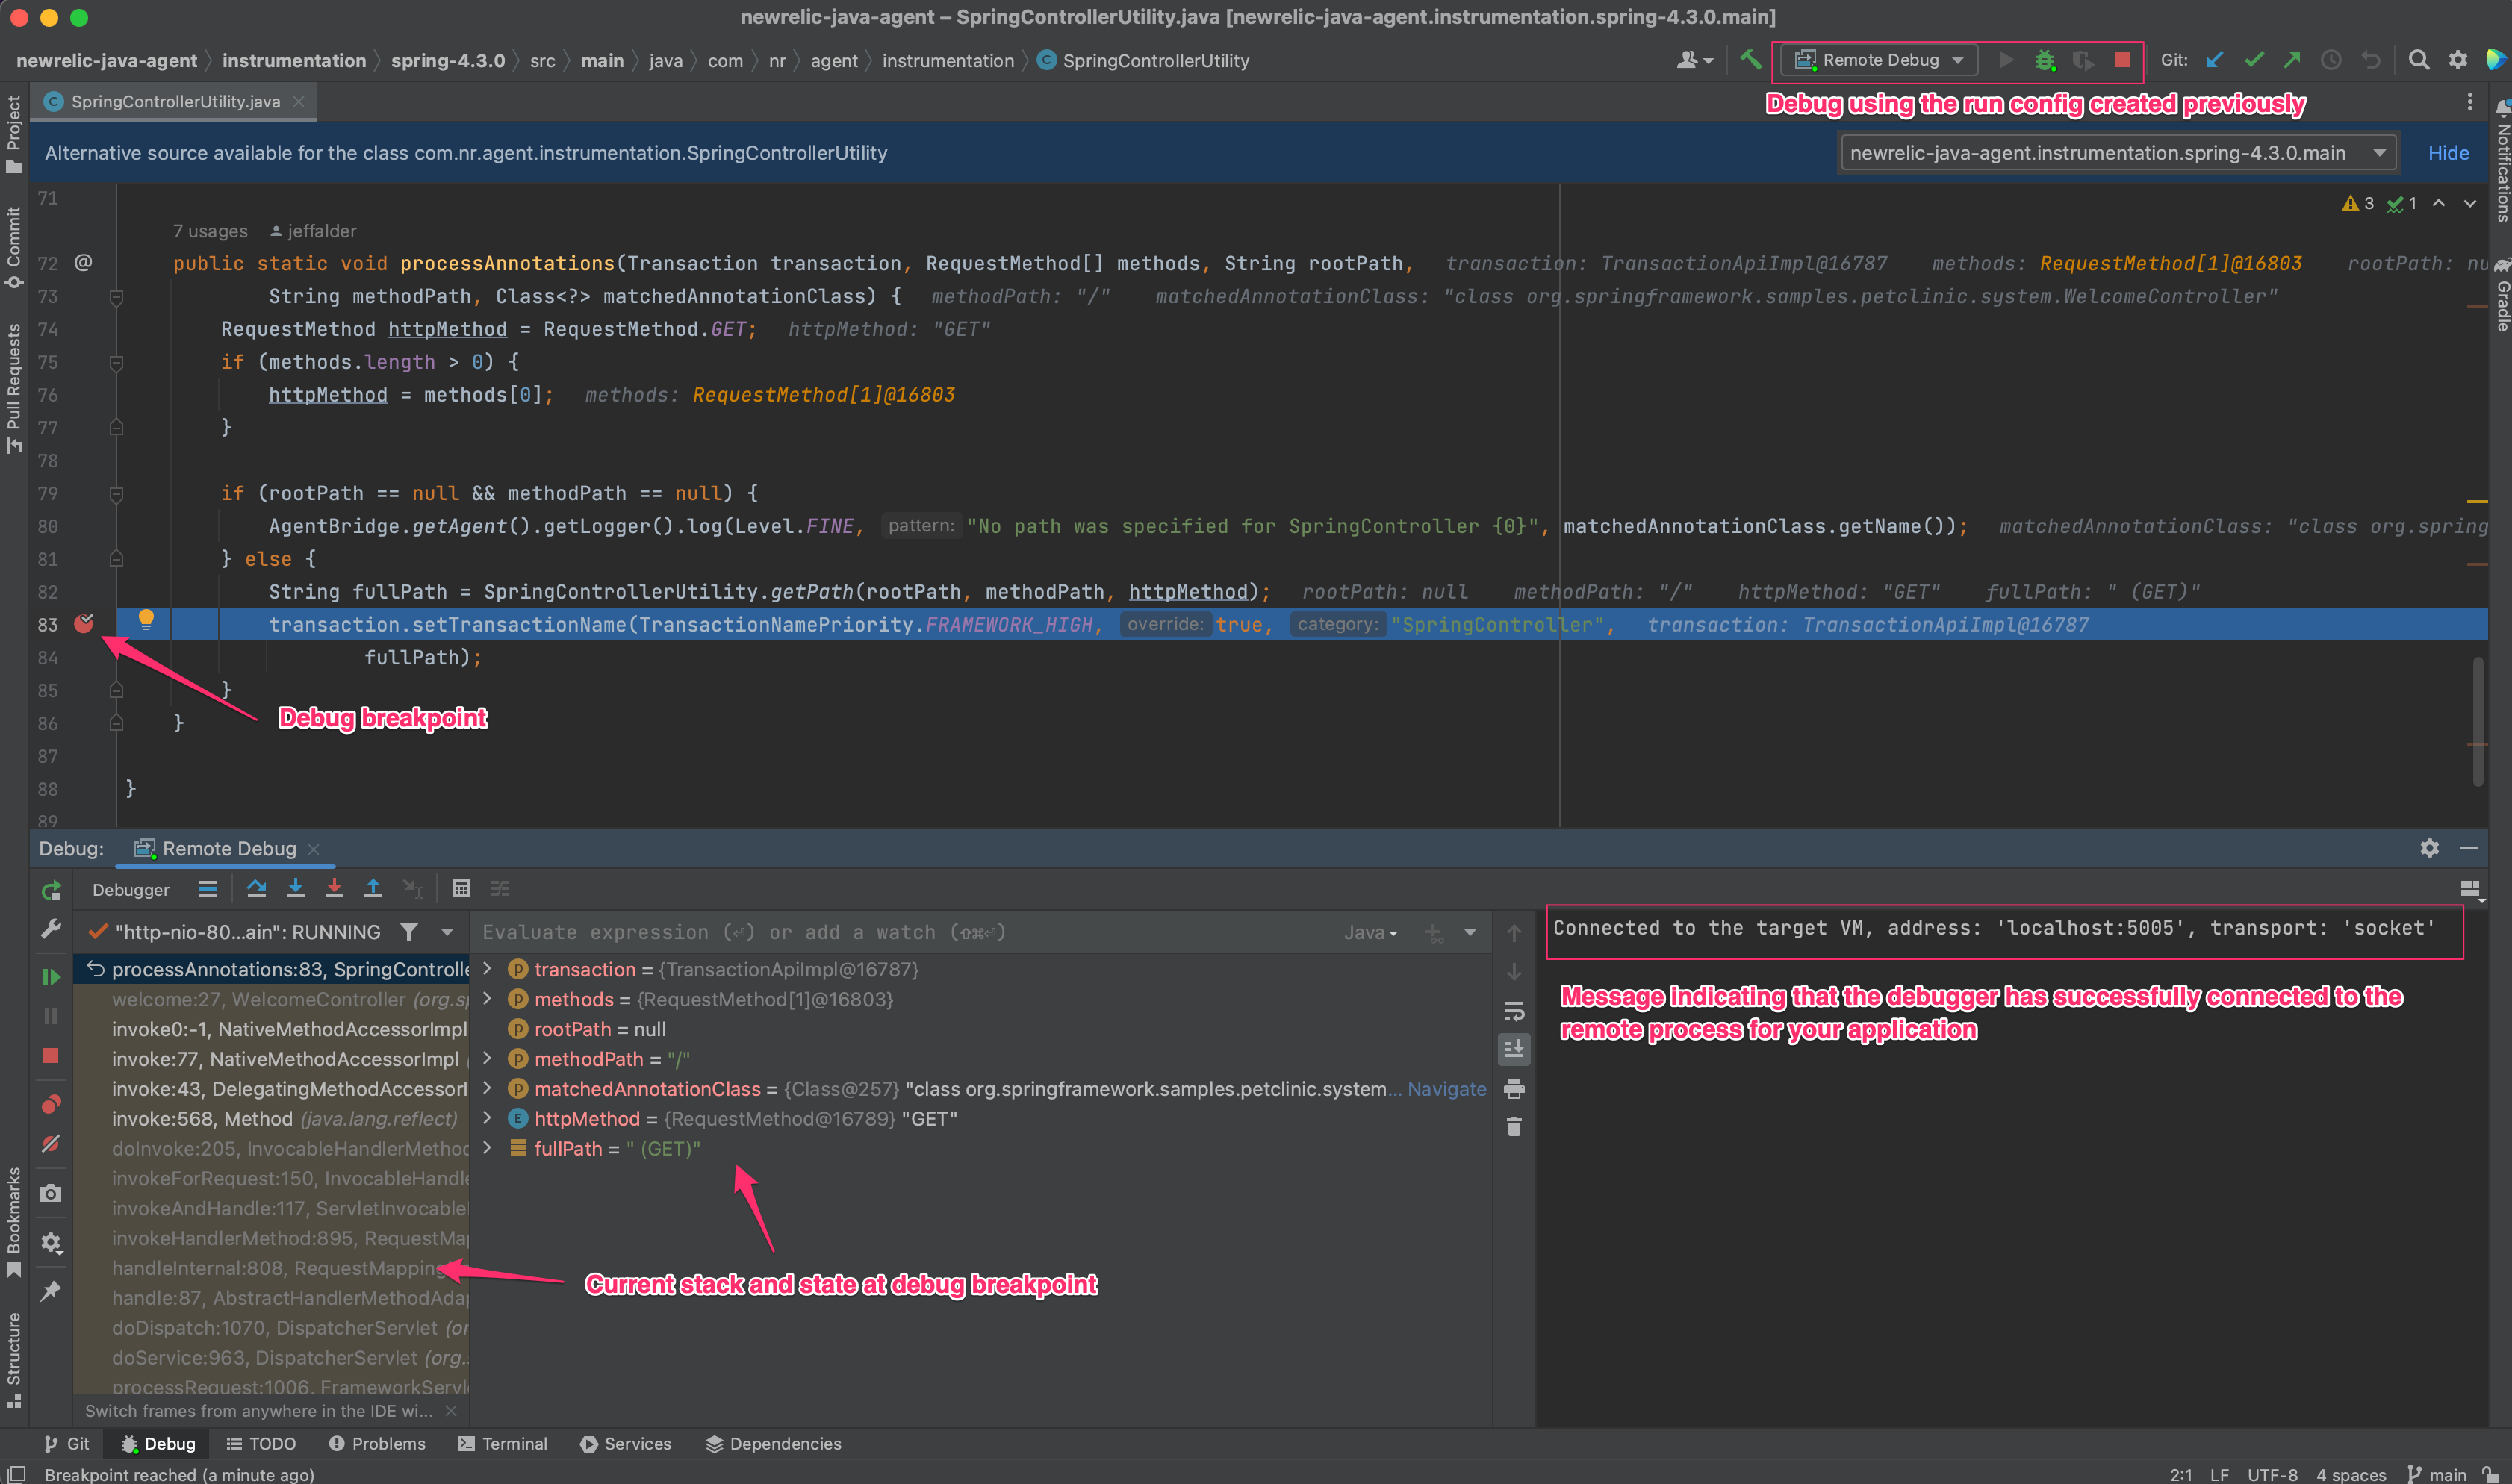
Add debug breakpoints to any code of interest in the Java agent project. Start the debugger in the agent project using the previously created run config. You should see console output indicating that the debugger has attached to the remote application process. Exercise code paths in the application to hit your debug breakpoints.
- You cannot add debug breakpoints to weaved framework/library classes in instrumentation modules, as the debugger will not stop on them, however you can add them to any New Relic utility classes that may exist in instrumentation modules.
- If you encounter the error
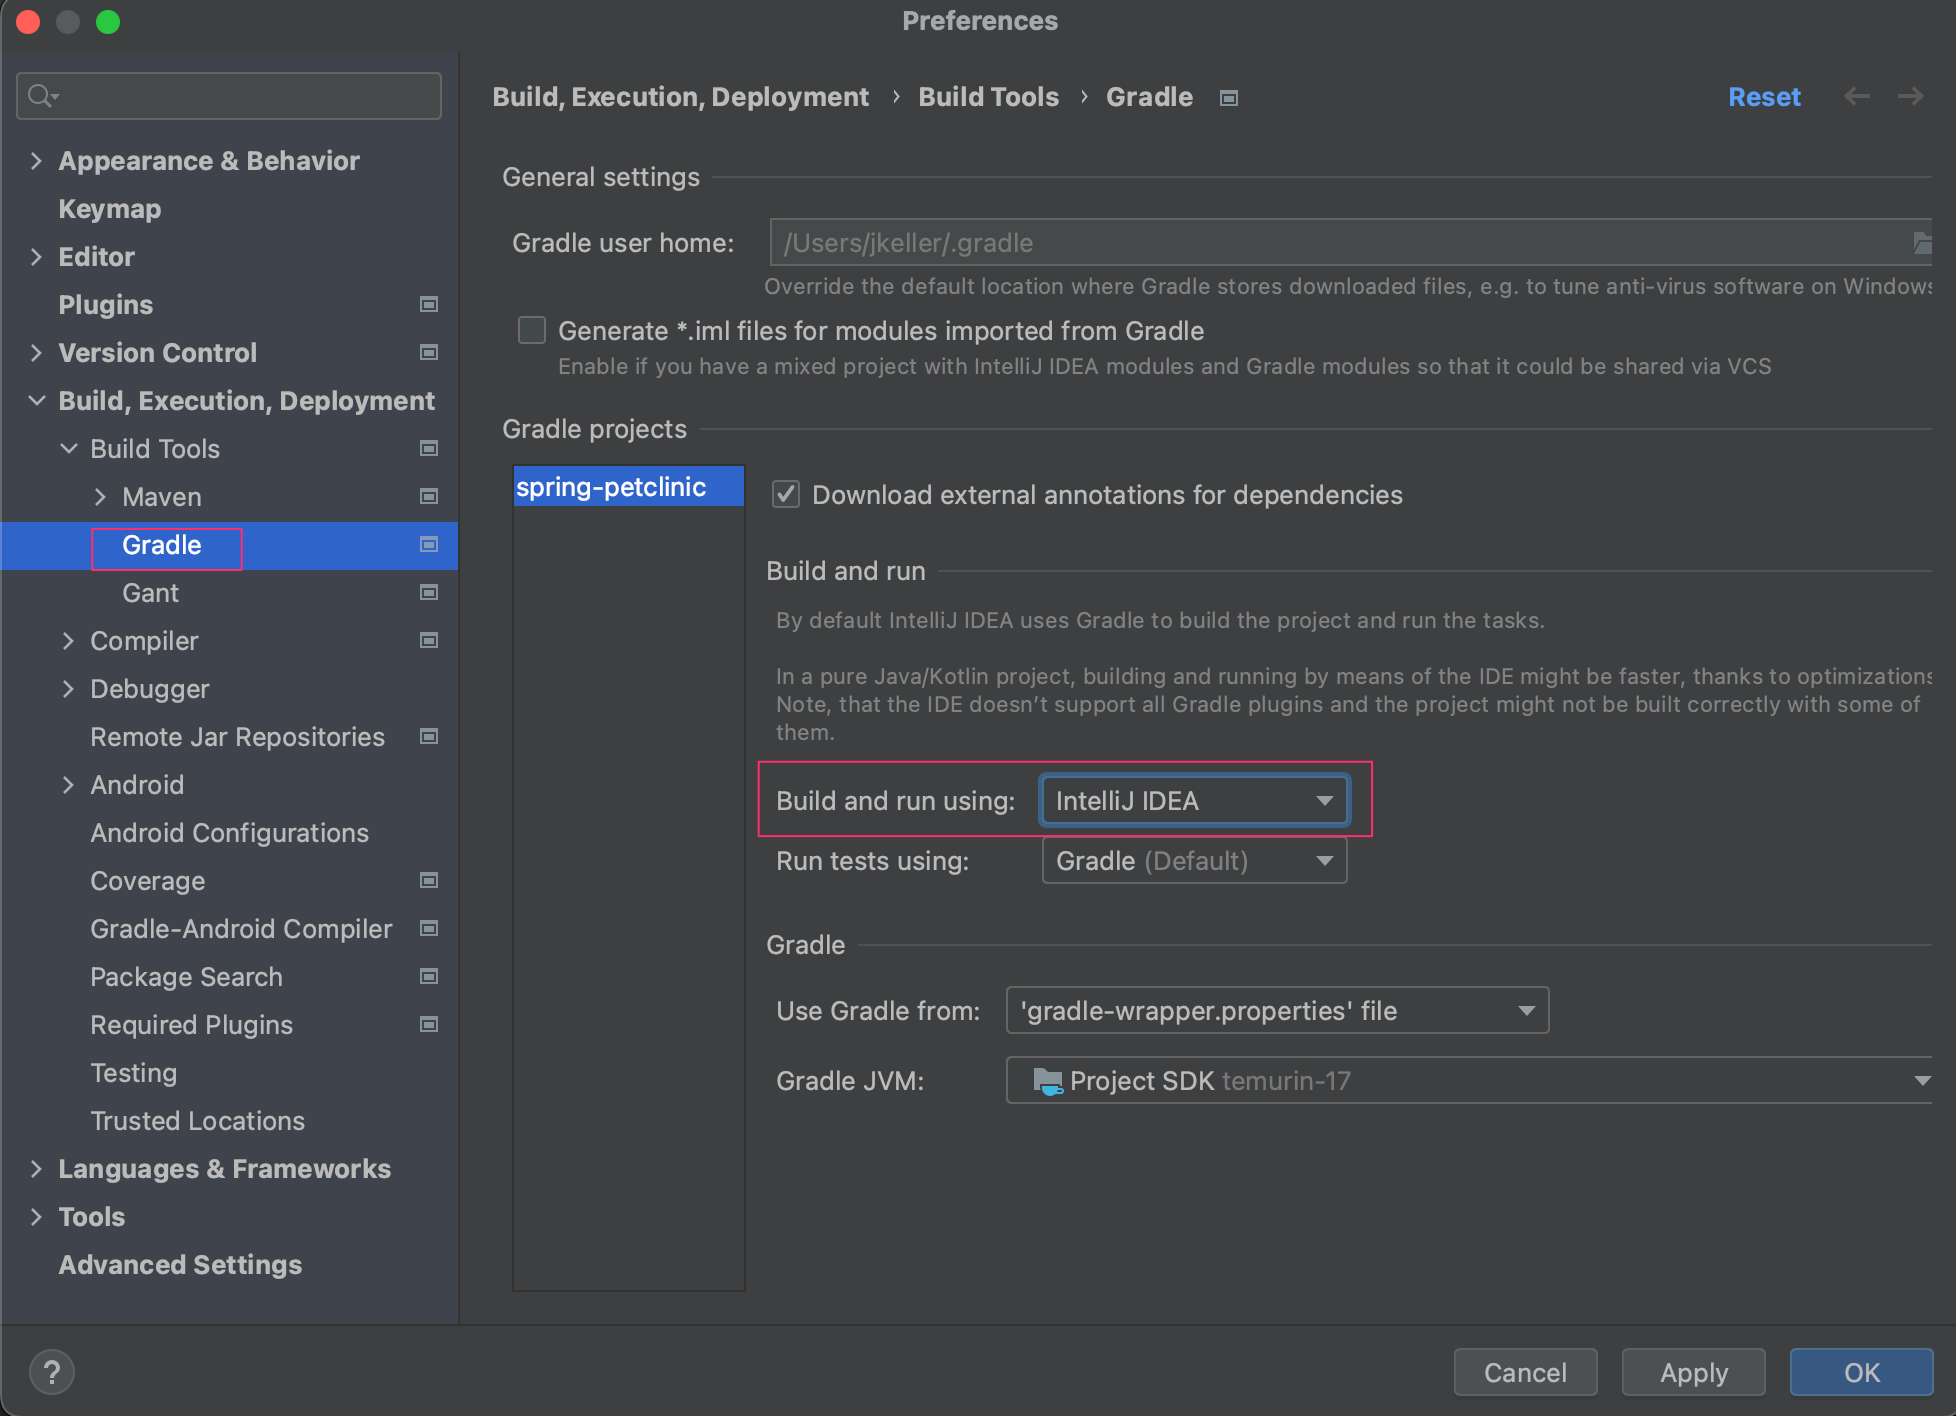
Cannot load this JVM TI agent twice, check your java command line for duplicate jdwp options.when starting your application then go to the IntelliJ IDEAPreferencesmenu and change the gradle settings toBuild and run using IntelliJ IDEA(see screenshot).
