why lifecycle events
A great motivation for having lifecycle events is the ability to extend your chart without having to modify your original code. Consider the following example:
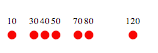
We create a chart that creates red circles along the x-axis and adds labels to them above the circles like so:
We define a chart to create the above layout:
d3.chart("CircleChart", {
initialize: function() {
// create a circle layer
this.layer("circles", this.base.append("g"), {
dataBind: function(data) {
return this.selectAll("circle")
.data(data);
},
insert: function() {
return this.insert("circle")
.attr("cy", 100)
.attr("r", 4)
.style("fill", "red");
}
});
// create a labels layer
this.layer("labels", this.base.append("g"), {
dataBind: function(data) {
return this.selectAll("text")
.data(data);
},
insert: function() {
return this.insert("text")
.attr("y", 90)
.style("font-size", 8)
.style("text-anchor", "middle");
}
});
// when new elements come in, put them through the
// enter callback, positioning them appropriatly
this.layer("circles").on("enter", function() {
return this.attr("cx", function(d) {
return d;
});
});
this.layer("labels").on("enter", function() {
return this.attr("x", function(d){
return d;
}).text(function(d) {
return d;
});
});
}
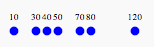
});Now, we want to create a chart where the circles are blue. That's pretty easy to do:
See live: jsBin
d3.chart("CircleChart").extend("BlueCircleChart", {
  initialize: function() {
    this.layer("circles").on("enter", function() {
      return this.style("fill", "blue");
    });
  }
});

var data = [10,30,40,50,70,80,120];
var chart = d3.select("#test")
  .append("svg")
  .style("width", 200)
  .style("height", 200)
  .chart("BlueCircleChart");

chart.draw(data);
That's all you need to do!
Now your BlueCircleChart has all the behavior of the CircleChart, except it adds
its own functionality through the lifecycle event.
If you wanted to add functionality that did not exist in the previous chart (such as animating the entering circles,) that's easy enough to do too:
See live: jsBin
d3.chart("CircleChart").extend("BlueCircleChart", {
  initialize: function() {
    this.layer("circles").on("enter", function() {
      // start off with a radius of 0
      return this.attr("r", 0);
    });

    this.layer("circles").on("enter:transition", function() {
      // grow the radius to 5
      return this.attr("r", 5);
    });
  }
});