v1.7
Province/State Level Data
- Added state-level data for Germany (Contributed by @stuffmc) (Data source)
- Added state-level data for Austria (Contributed by @patricks) (Data source)
- Added province-level data for many other counties (Data source)
- Show provinces in the charts when a country is selected and province data is available.
Fullscreen Charts
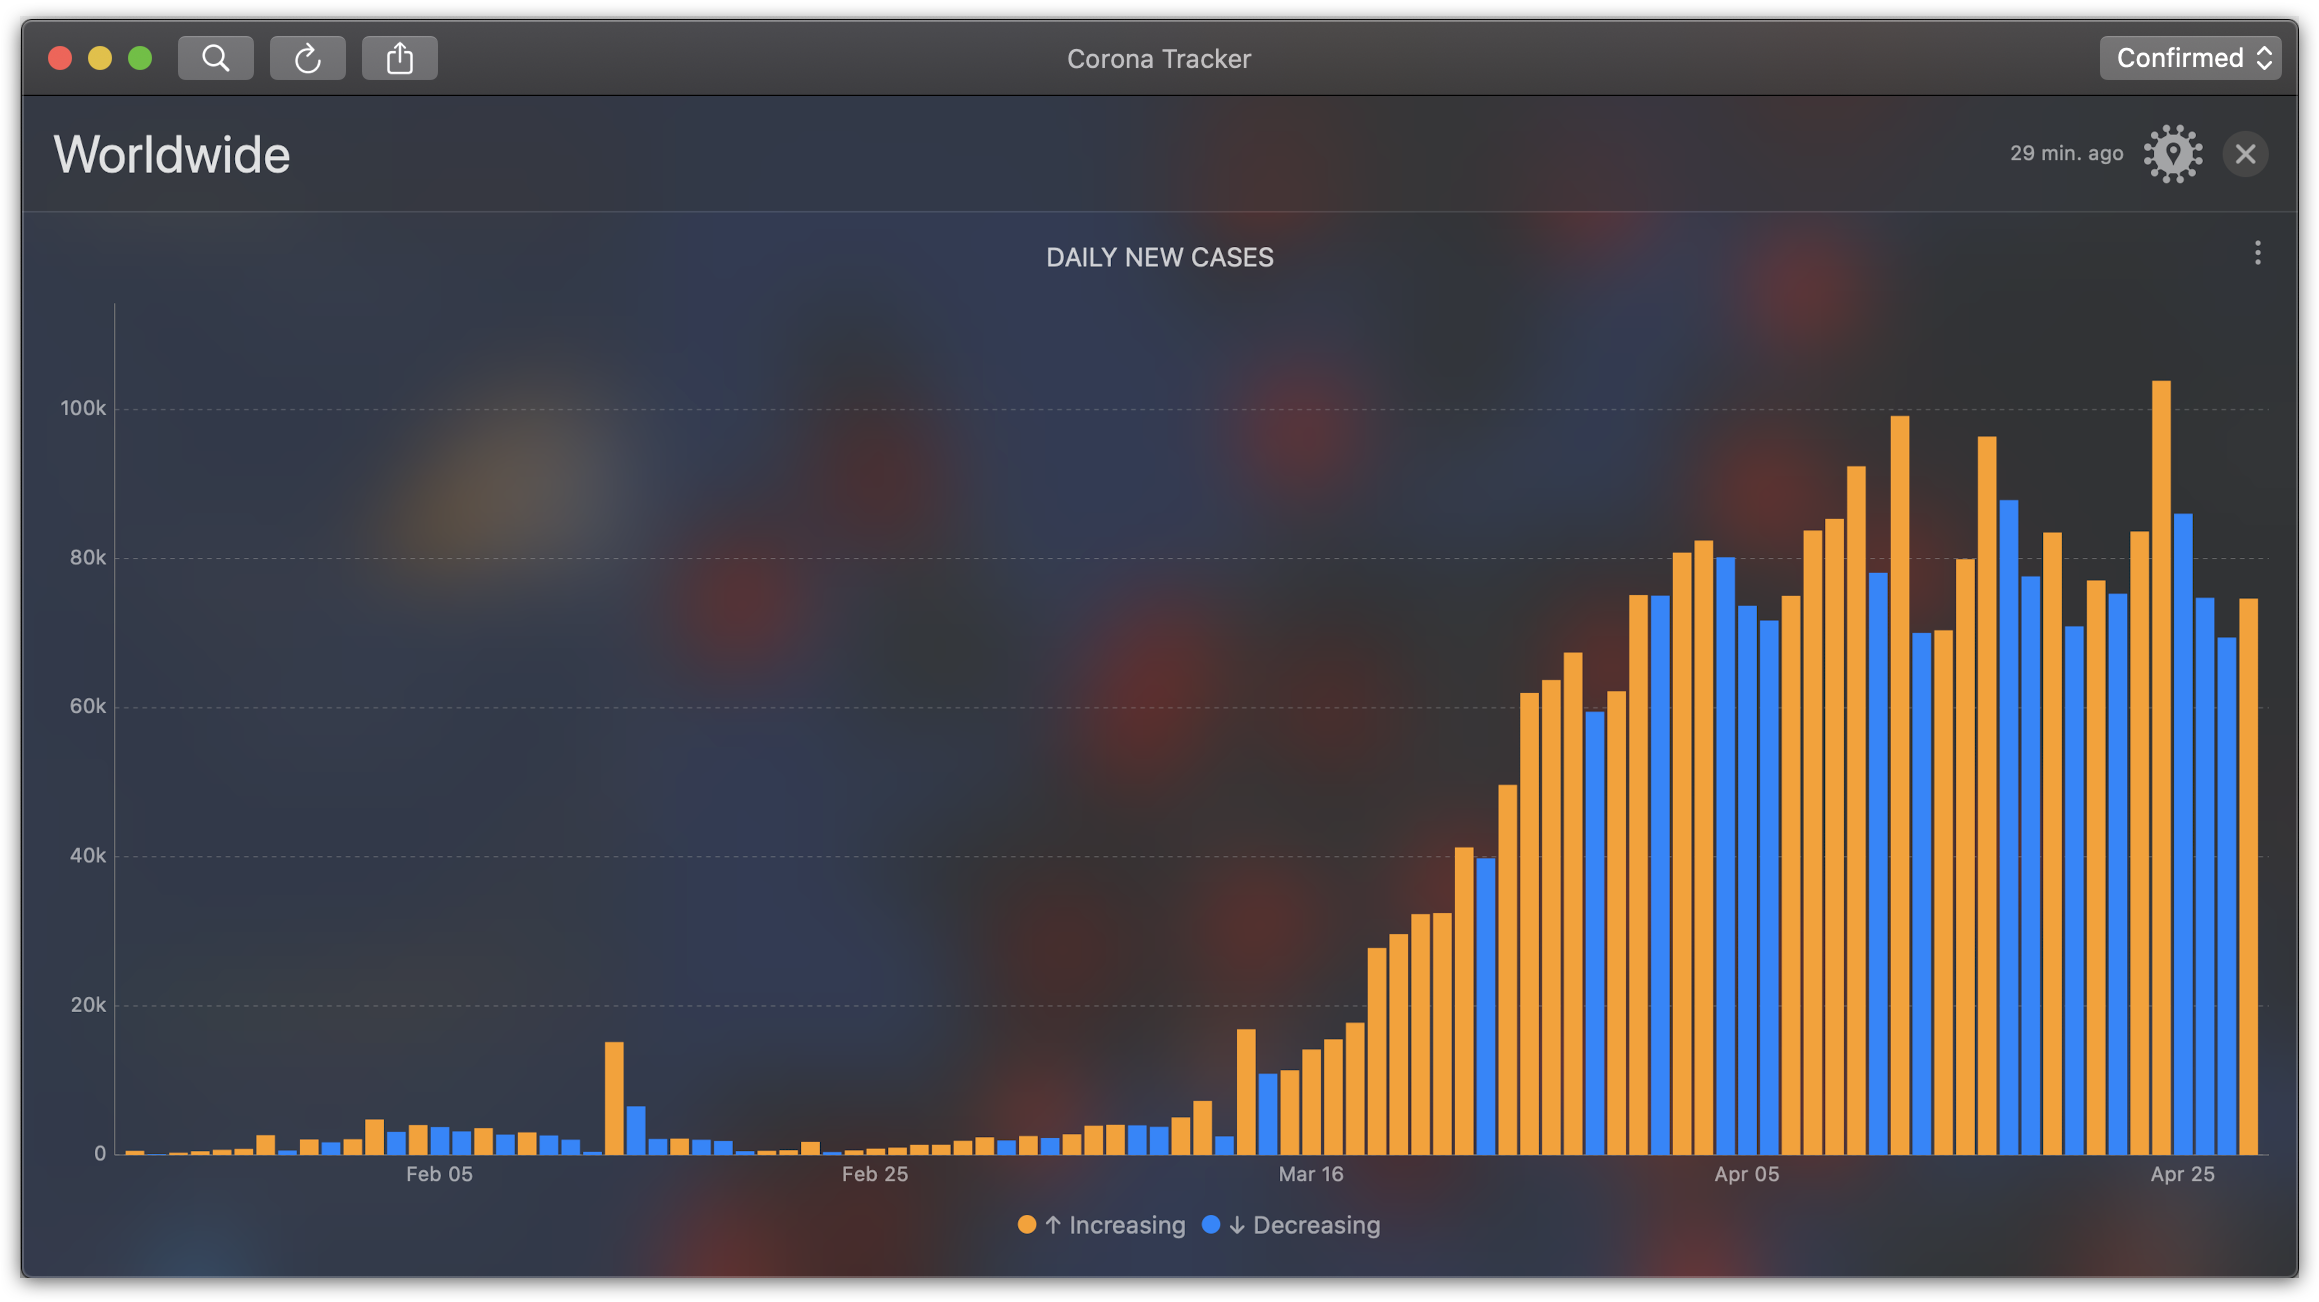
As the volume of the data increases, it becomes more difficult to read charts and interact with them. With the new chart screen, you can now see the charts fullscreen and zoom in to see the finest details.
- Tap/click on a chart to open it in a fullscreen mode.
- Swipe down (iOS) or press the ESC button (macOS) to dismiss.
New Chart Options
- Added an option to show the total deaths since the 10th death.
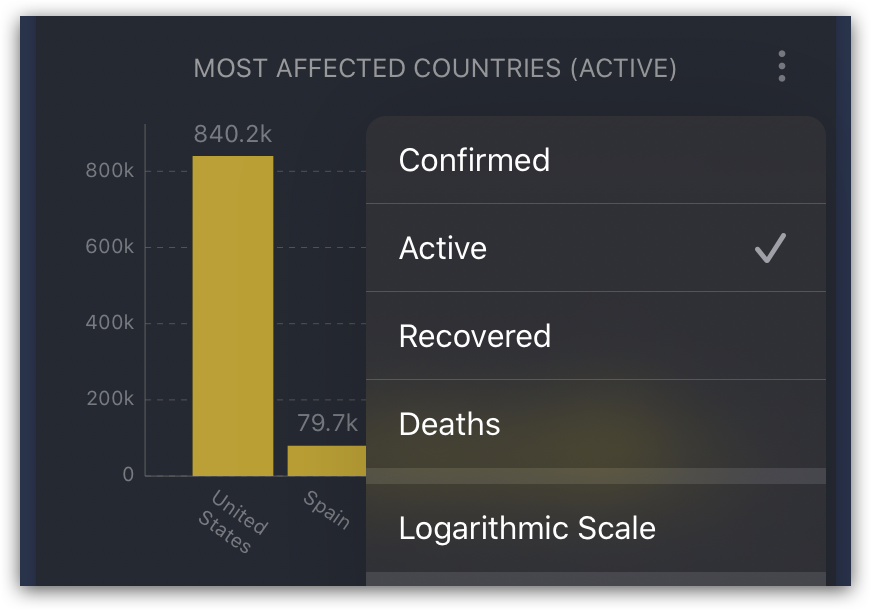
- Added an option to show the active cases for the most affected countries chart.
- Added a logarithmic scale option to all charts.
Better macOS UI
- Added a toolbar to the main window
- Added menu items and keyboard shortcuts for the main actions.
Ten New Translations
- Dutch by @hdatteln
- Romanian by @rhcpfan
- Korean by @dev-yong
- Arabic by @hussamzain
- Norwegian Bokmål by @comradekingu
- Indonesian by @nikotidar
- Danish by @peme
- Chinese, Traditional (Taiwan) by @League2EB
- Turkish by @nesimtunc
- Hungarian by @BrotherLouie
And lots of improvements, bug fixes, and UI enhancements.
A big thank you to all who have contributed or supported this project in any way. Stay safe, stay healthy!


