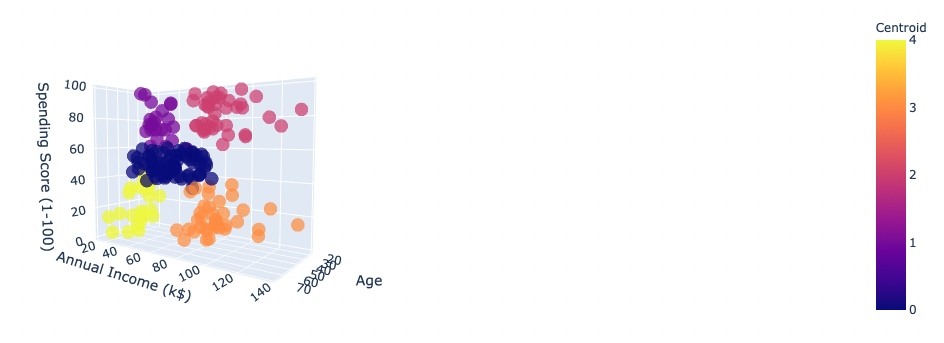
Customer segmentation uses unsupervised machine learning to divide customers into common characteristics based on its optimal number of clusters and generates a three-dimensional model that displays consumer profiles.
In order to help companies and businesses understand their targeted customers, it is important that such businesses have a thorough understanding of how their consumers use their services. Many successful businesses thrive because they cater towards each customers' needs, rather than holding the assumption that everyone is interested in the one product you're selling. For instance, Tesla's segmentation encaptures income levels, life-style, and age demographics. (https://research-methodology.net/tesla-segmentation-targeting-and-positioning-overview/). Seeing these companies personalize their tactics based on common demographics inspired me to implement an algorithm that segments customers into common groups based on their customer needs.
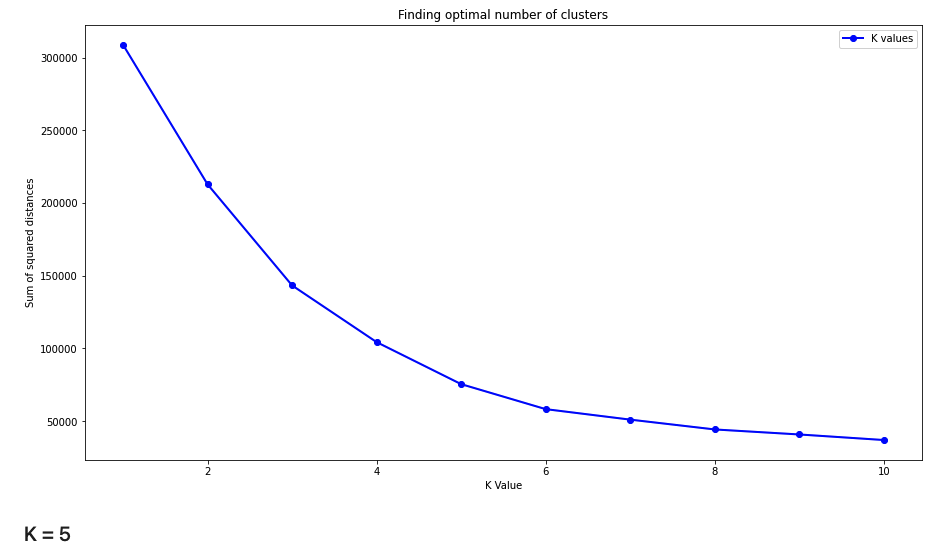
Customer segmentation algorithm consumes a csv file of three demographic variables and determines the optimal number of clusters using K-means clustering (since we are working with unlabelled data) and the elbow method (For more info on the elbow method: https://www.scikit-yb.org/en/latest/api/cluster/elbow.html ).
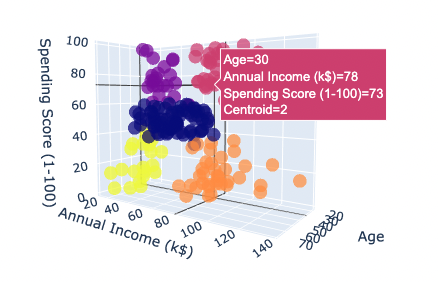
Finally, in order to display the clusters, Plotly Express was used to generate an interactive 3D model that also presents individual demographics.
My main goal in developing my customer segmentation algorithm was to increase efficiency and identify customer targets. A step for improvement would be to analyze the loyalty of a customer which would allow companies to customize promotions based on the quality of their customers (usually this is how often/how much they consume the company's product/services). An example of this would be Aritzia's annual clientele sale where Gold tier customers-- $2500 to $5000 annual spend-- are given higher promotions (https://fabricandfit.com/comprehensive-guide-to-the-aritzia-clientele-sale-2020/).