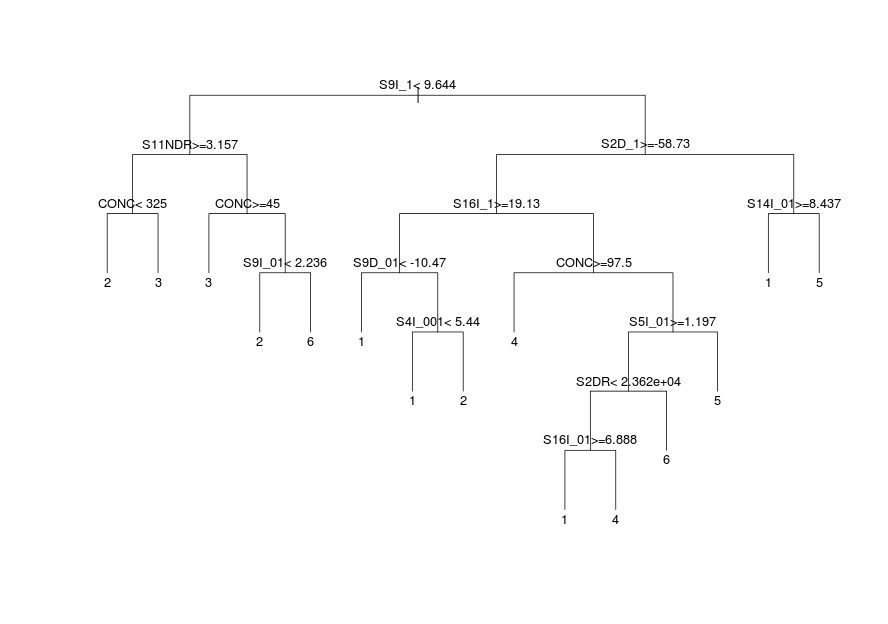
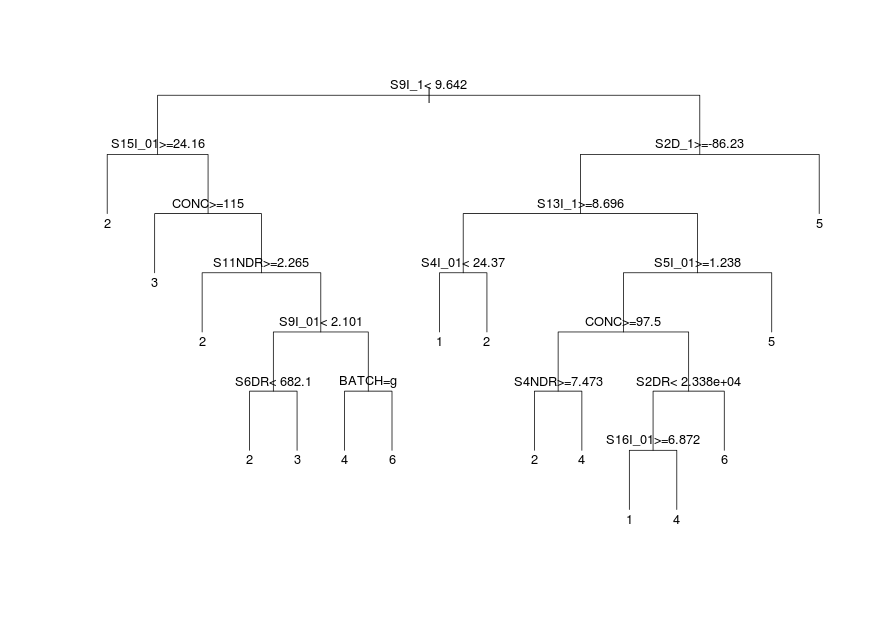
Entropy and Gini Trees
Basic decision tree model on gas sensor array data. Two trees were constructed based on Entropy and Gini split criteria in R. Results are presented below.
Examples of how to read feature names on the tree
S2DR - Direct Resistance of sensor 2
S11NDR - Normalized Direct Resistance of sensor 11
S9I_1 - Exponential Moving Average with a smoothing parameter of 0.1 when current is increasing for Sensor 9
S9D_01 - Exponential Moving Average with a smoothing parameter of 0.01 when current is decreasing for Sensor 9
CONC - Concentration (ppmv)
Optimum Number of Splits - 14
Misclassification Rate - 16.28% (on test data)
Entropy Confusion Matrix
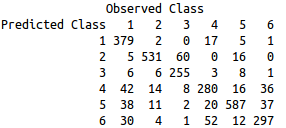
Classes - 1: Ethanol; 2: Ethylene; 3: Ammonia; 4: Acetaldehyde; 5: Acetone; 6: Toluene
Optimum Number of Splits - 15
Misclassification Rate - 15.49% (on test data)
Gini Confusion Matrix

Classes - 1: Ethanol; 2: Ethylene; 3: Ammonia; 4: Acetaldehyde; 5: Acetone; 6: Toluene
ROC Curves

Area Under Curve
Entropy Tree - 0.9548684
Gini Tree - 0.9592732