Authors: Caddick, Z. A., Dieckmann, N. F., Shafer, B. M., McHill, A. W.
Laboratory: Sleep, Chronobiology, & Health Laboratory
Citation: Caddick, Z. A., Dieckmann, N.F., Shafer, B.M., McHill, A. W. (In Prep). Sleep and Susceptibility to False Information in the Digital Age.
For help or more information contact caddickzac@gmail.com.
- News Task: 60 news headlines with an accompanied image were curated using a format similar to social media websites. True news items were extracted from news websites (e.g., Reuters) and false news items were extracted from a mix of websites debunking false claims. The 60 items were equally divided by type (true vs false; 30 items) and domain (Covid-19, “The Big Lie” about the outcome of the 2020 election; 30 items). Participants rated their belief in the veracity of each question (“to what extent you believe the above headline represents accurate/true news?”) and a belief confidence question (“how confident are you in your assessment of the headlines’ truthfulness?”), both on a 0-100 visual analog scale.
- Sleep Measure: Sleep and wake times for work and non-work days.
- Cognitive Reflection Test (v2): Cognitive reflection measures the ability to override intuitive responses.
- Health Literacy: Behavioral measure of health literacy.
- News Task Debrief: Participants were debriefed at the conclusion of the survey about the accuracy of each headline presented.
- Measure Scoring: See "All Measures.docx" for scoring information alongside each measure.
- Qualtrics Survey: A copy of the Qualtrics survey has been made available for import.

- Note: Item Level Data is at the level of a headline task item, whereas the Measure Level Data is the at level of each sub-headline measure (e.g., "real-news: Covid, fake-news: Covid, real-news: The Big Lie, fake-news: The Big Lie). For simplicity, derivation data is omitted but is available upon request (email: caddickzac@gmail.com).
- Item Level Data
- Measure Level Data
- Note: The setup script imports data, loads relevant packages and presents a data dictionary for each of the uploaded datasets. The "Models" script must run before the "Figure 2 & 3" script is run.
- Analysis & Figure Setup Script
- Mixed-Effects Models
- Figure 2 & 3
- Figures 4 & 5
Figure 1. STROBE diagram flow chart.
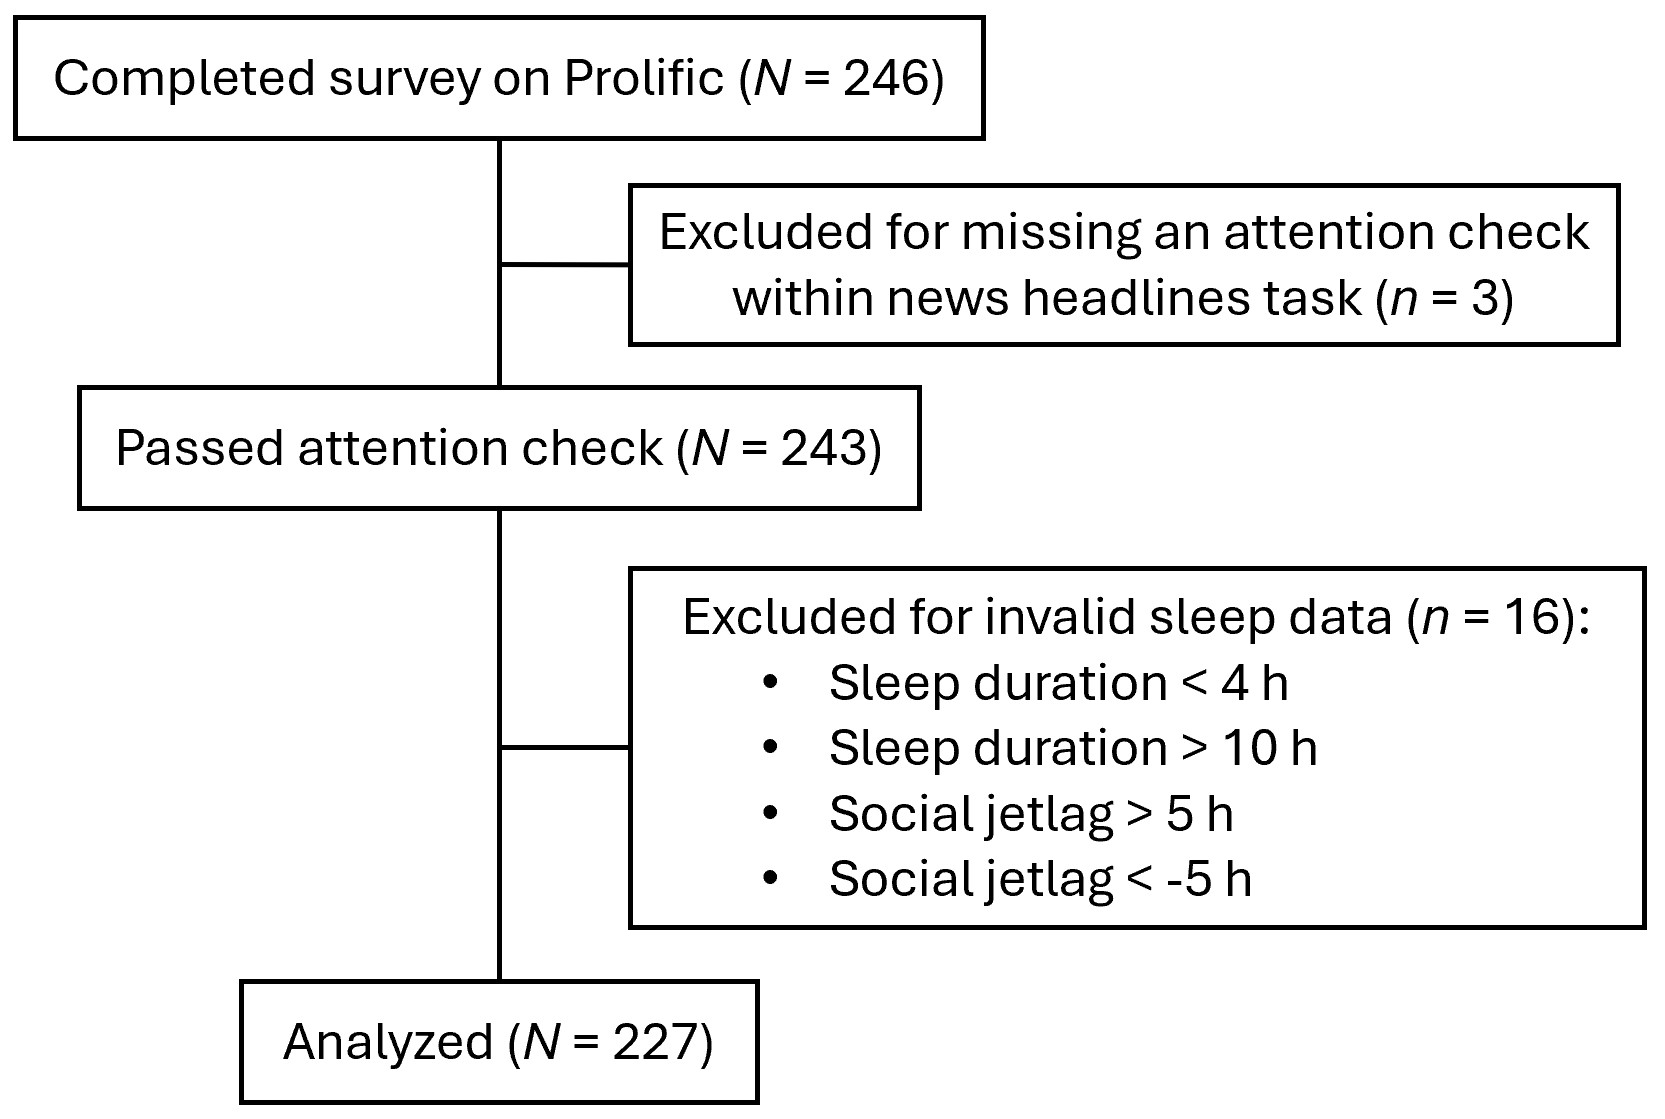
Figure 2. Predictors for accurately identifying news items as true or false using mixed-effects modeling (95% CI). Political identity denotes participants that self-identified as liberal (n=109) or conservative (n=118), news type denotes false vs real news items, and news domain denotes Covid-19 vs the 2020 US election news items. Predictors with an asterisk denote statistical significance (p<0.05) within the model. Sleep duration and social jetlag by news type (false vs real) interactions are highlighted in red as they were the primary hypotheses in the current investigation. Total variance explained using all predictors: sleep duration model R2 = 22.67% & social jet lag model R2 = 22.76%.
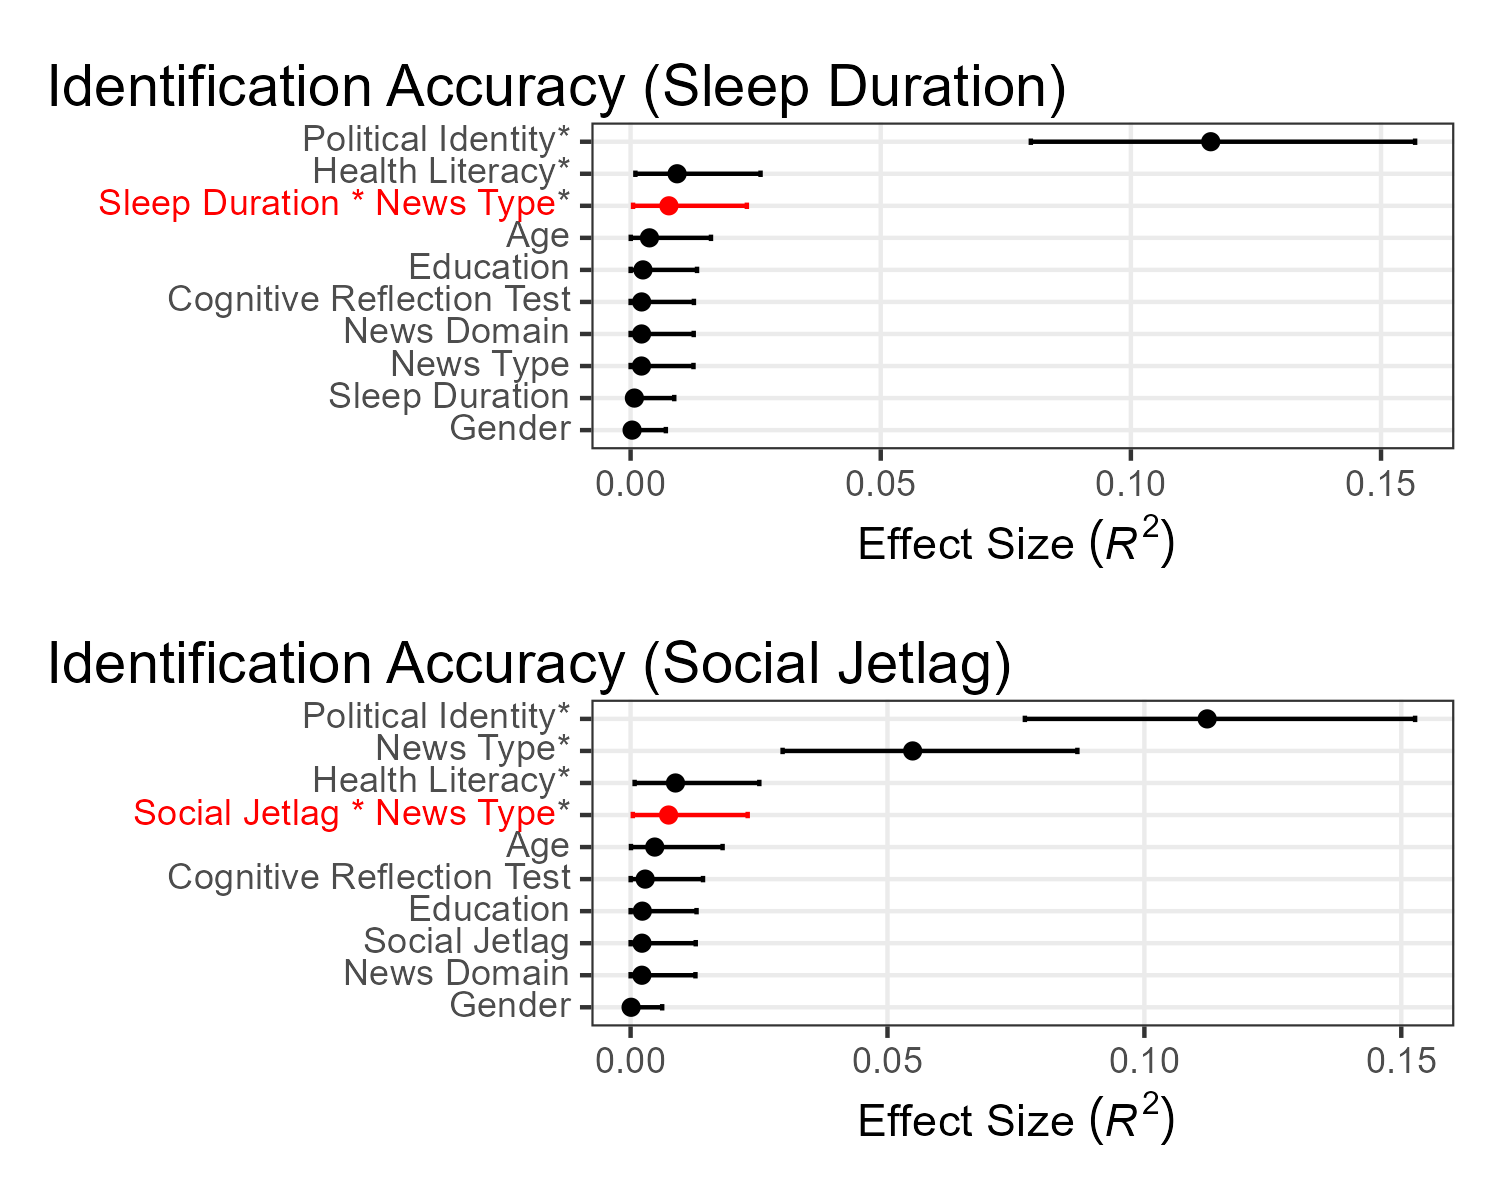
Figure 3. Predictors for confidence in accuracy of identifying news items as true or false using mixed-effects modeling (95% CI). Participants could be confidently correct (accurately assessing something that is false as false or real as real) or confidently incorrect (inaccurately assessing something that is false as real or real as false). Political identity denotes participants that self-identified as liberal (n = 109) or conservative (n = 118), news type denotes false vs real news items, and news domain denotes Covid-19 vs the 2020 US election news items. Predictors with an asterisk denote statistical significance (p < 0.05) within the model. Sleep duration and social jetlag by news type (false vs real) interactions are highlighted in red as they were the primary hypotheses in the current investigation. Total variance explained using all predictors, confidently correct: sleep duration model R2 = 13.54% & social jet lag model R2 = 13.71%; confidently incorrect: sleep duration model R2 = 16.20% & social jet lag model R2 = 15.56%.
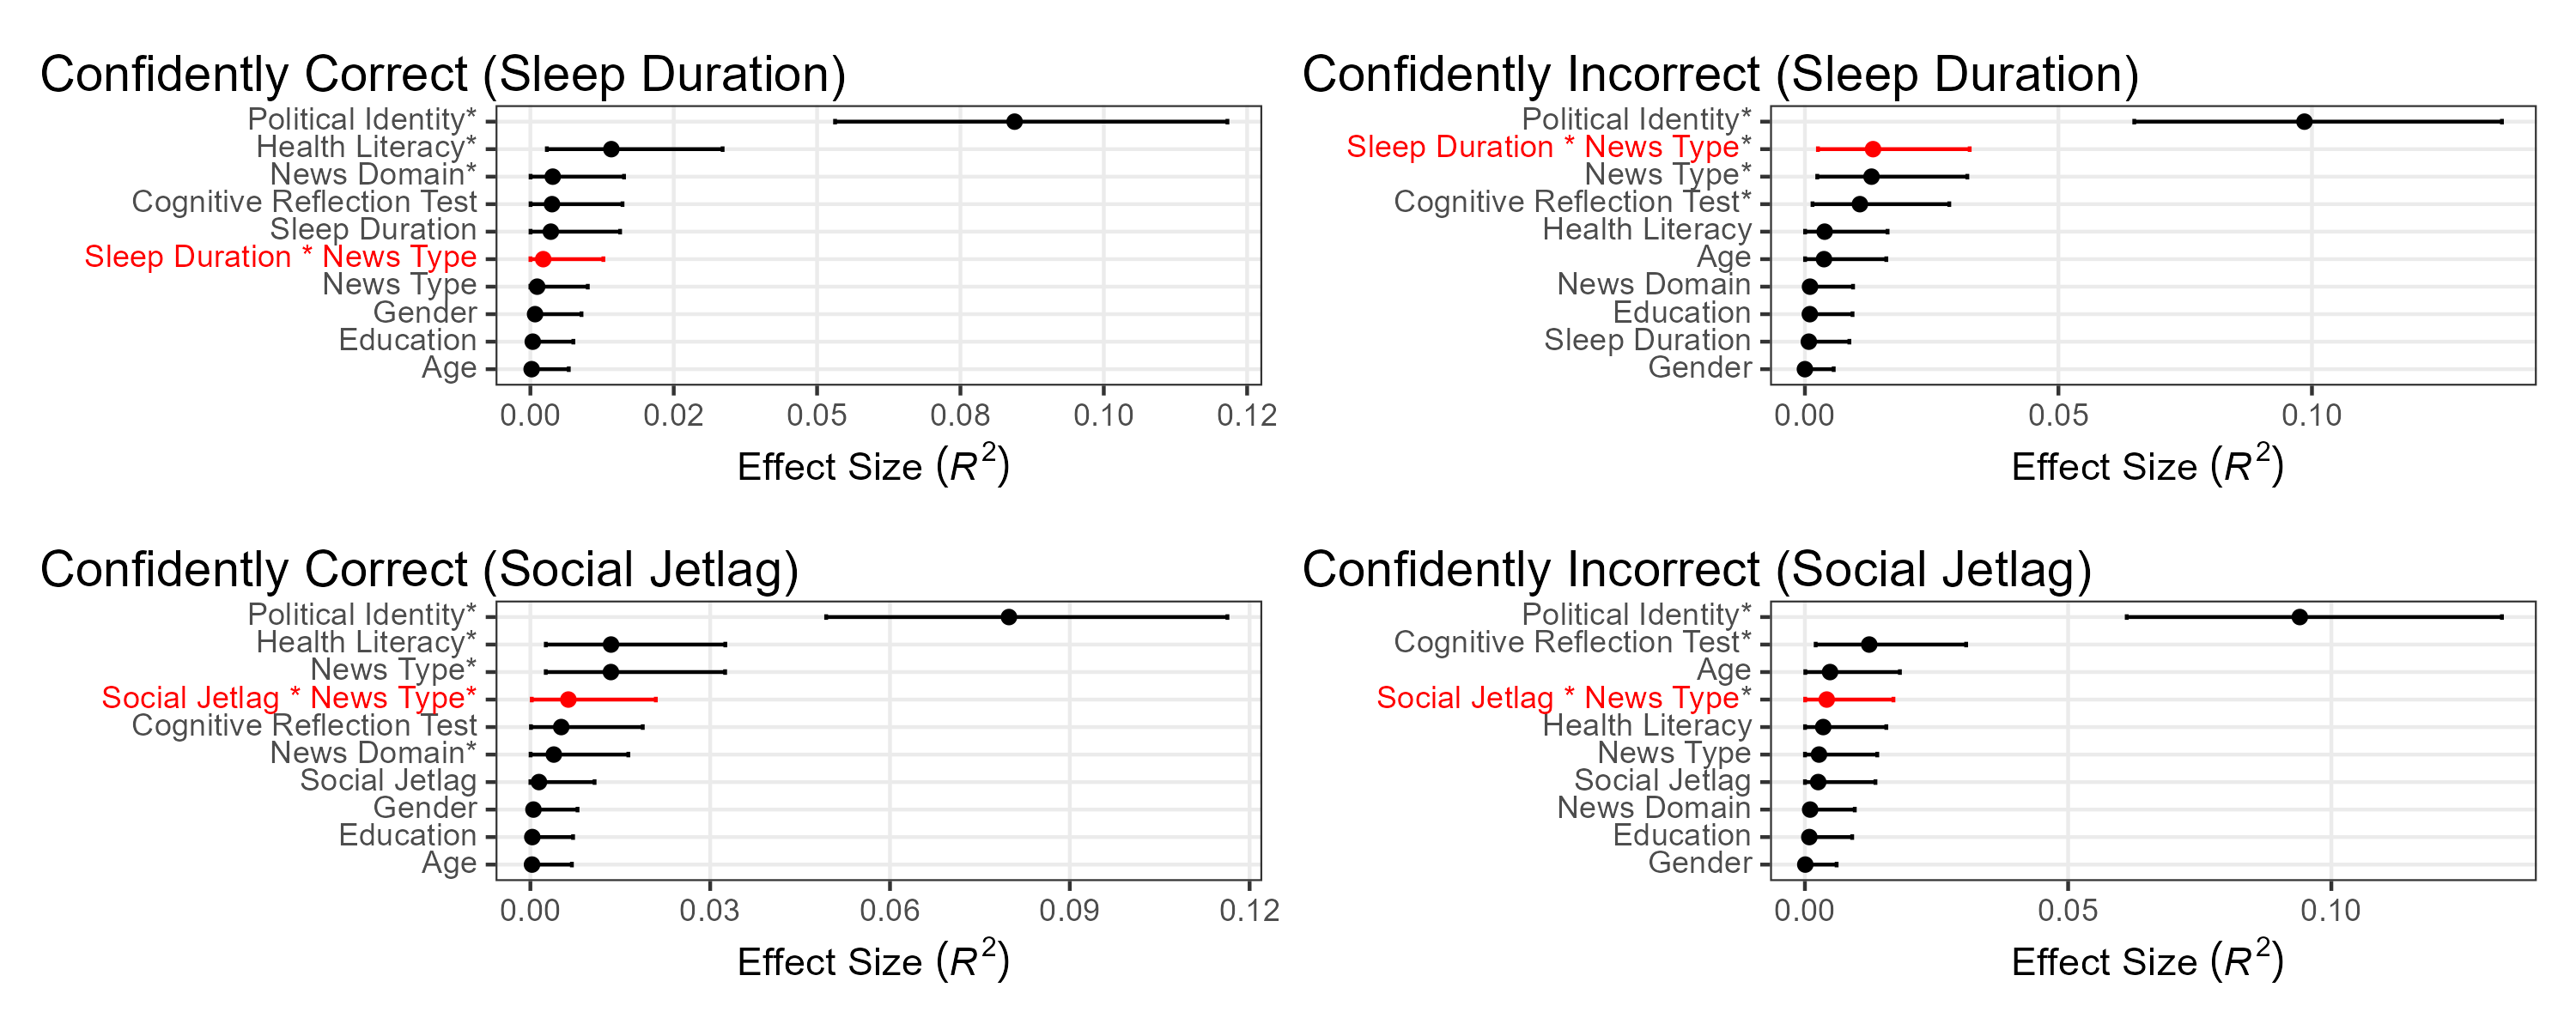
Figure 4. Accuracy of correctly identifying news items as either true or false & confidence percentages across sleeping duration. Note: The red bar represents group medians and the dotted line means. Sample size for each group: 4-6n = 13, 6-7n = 28, 7-8n = 85, 8-9n = 69, 9-10n = 32.
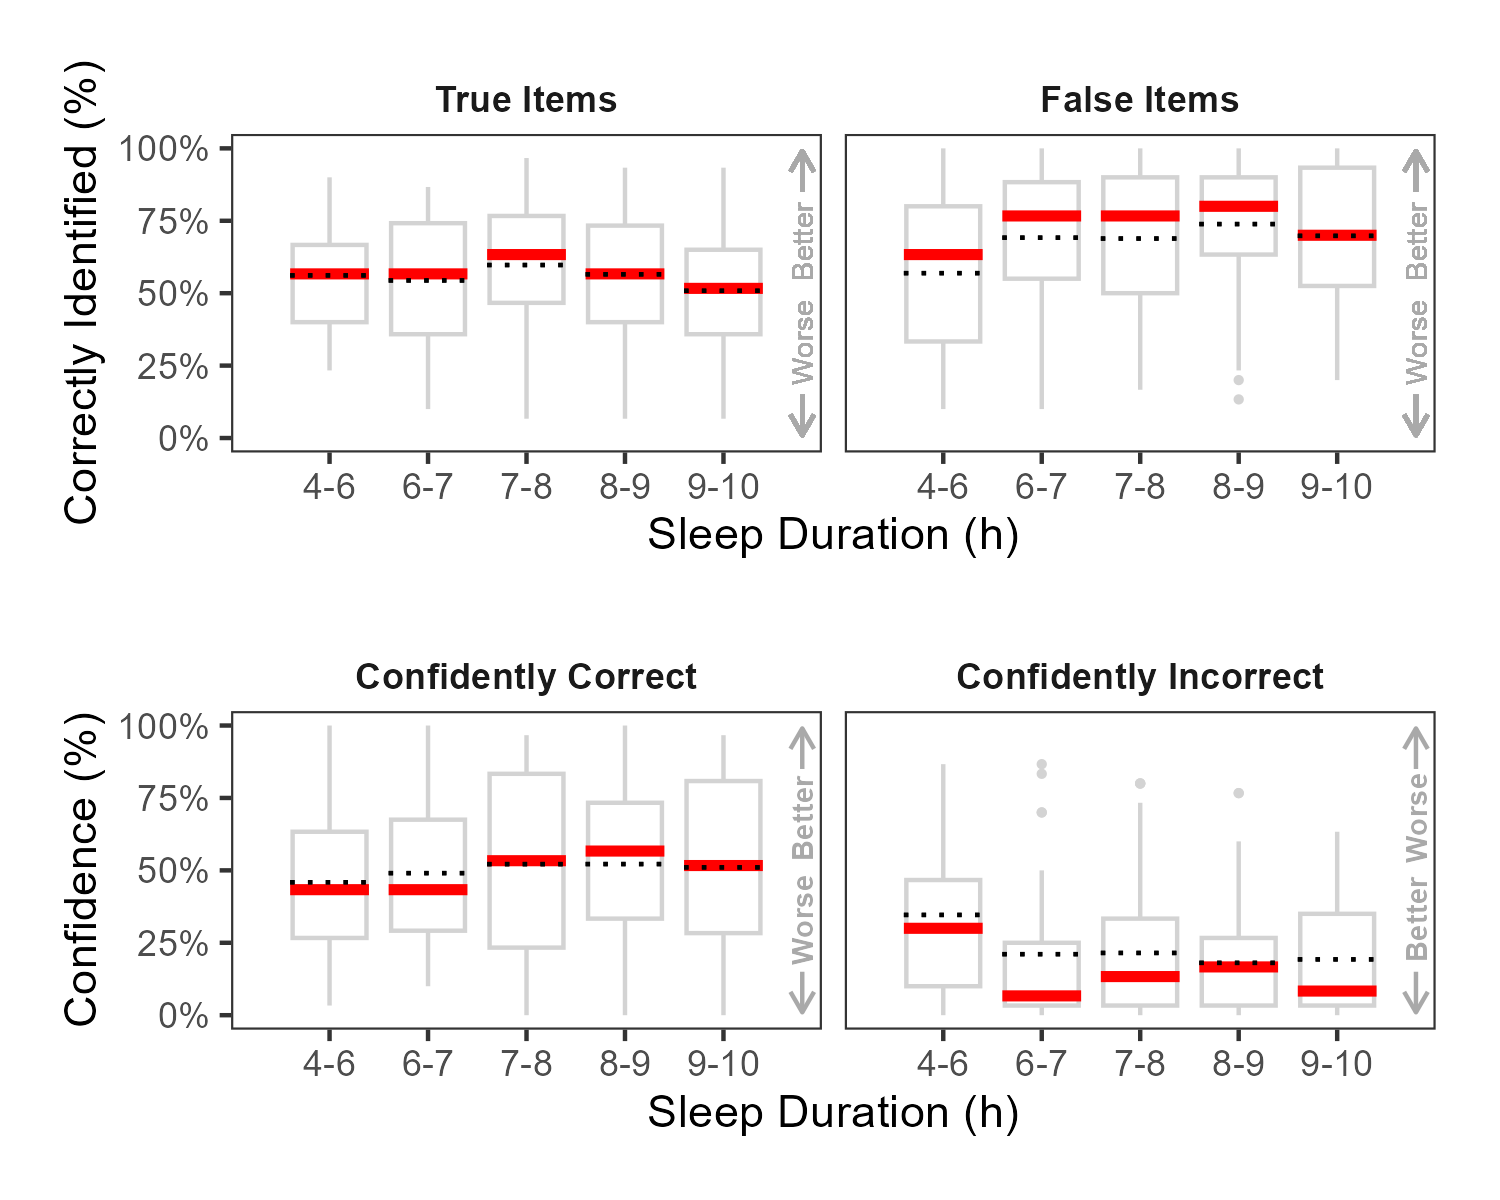
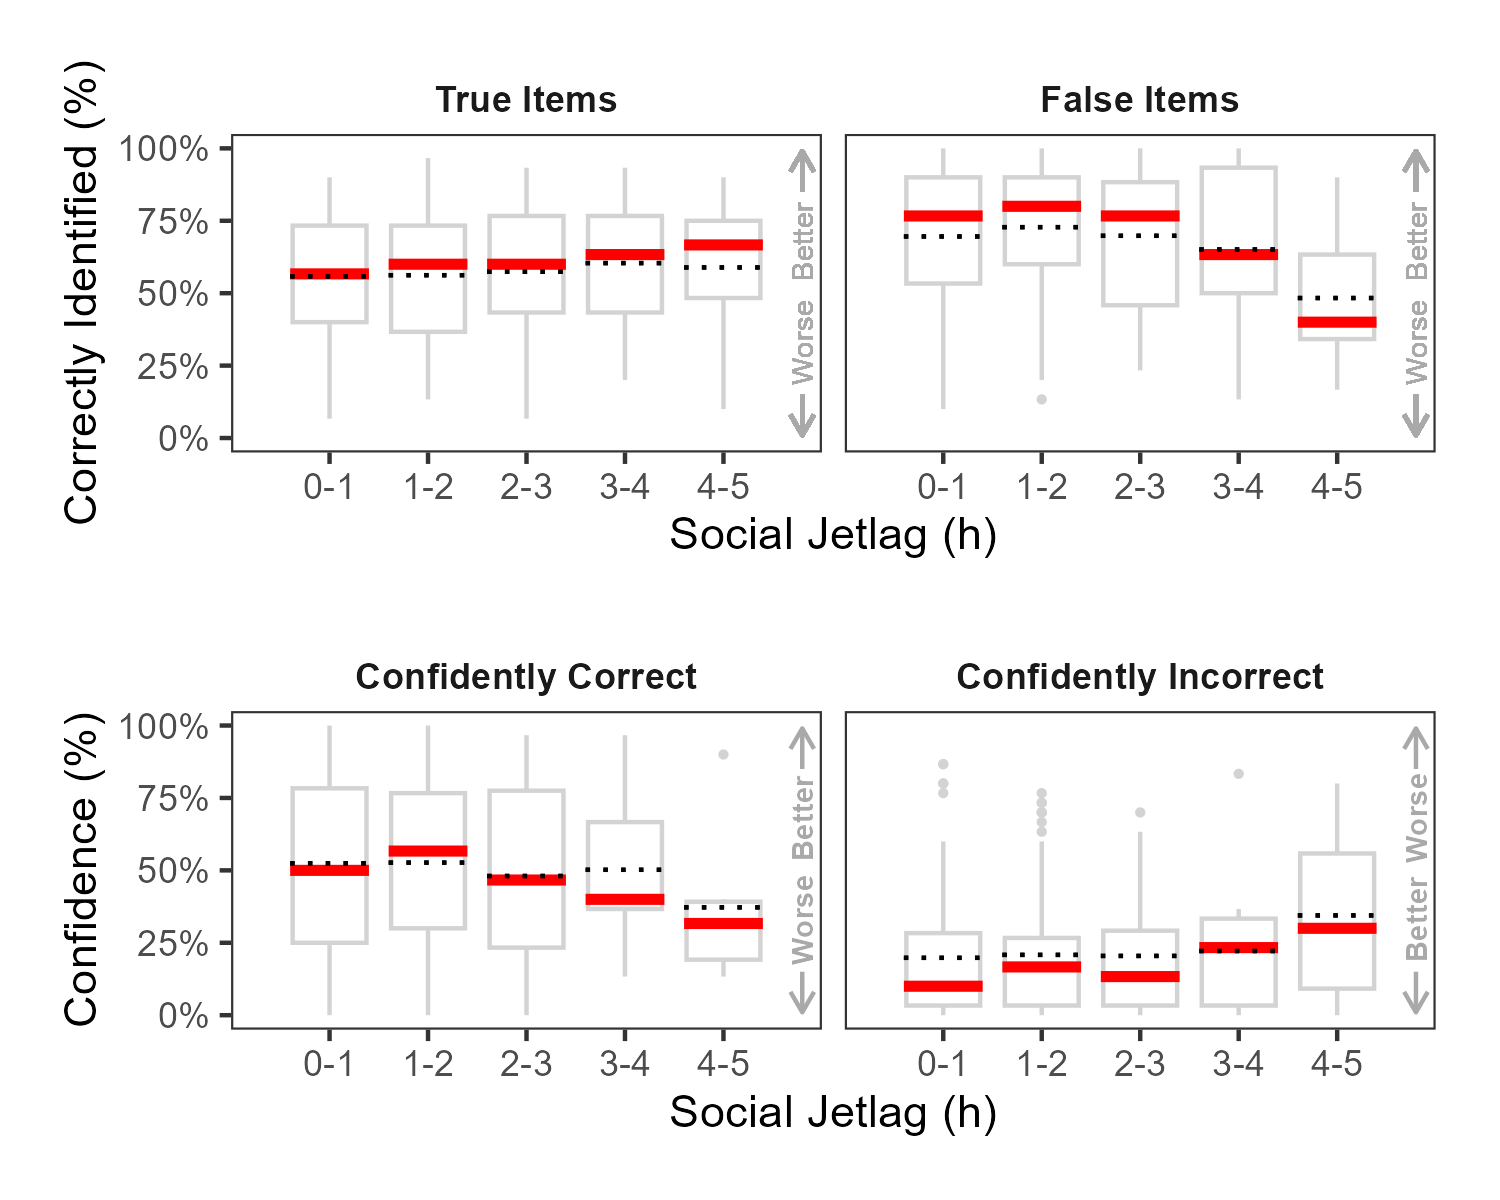
Figure 5. Accuracy of correctly identifying news items as either true or false & confidence percentages across social jetlag. Note: The red bar represents group medians and the dotted line means. Sample size for each group: 0-1n = 87, 1-2n = 81, 2-3n = 36, 3-4n = 17, 4-5n = 6.