This is a WIP dashboard displaying metrics and stats from TheGraph. Built with Python and Streamlit. Using GraphQL to query the TestNet Subgraph of the Graph. It contains informations on:
- Overview of Network Stats
- Subgraphs (List of Subgraphs with Descriptions, Rewards, Signals and More)
- Curators (List of Curators, ...)
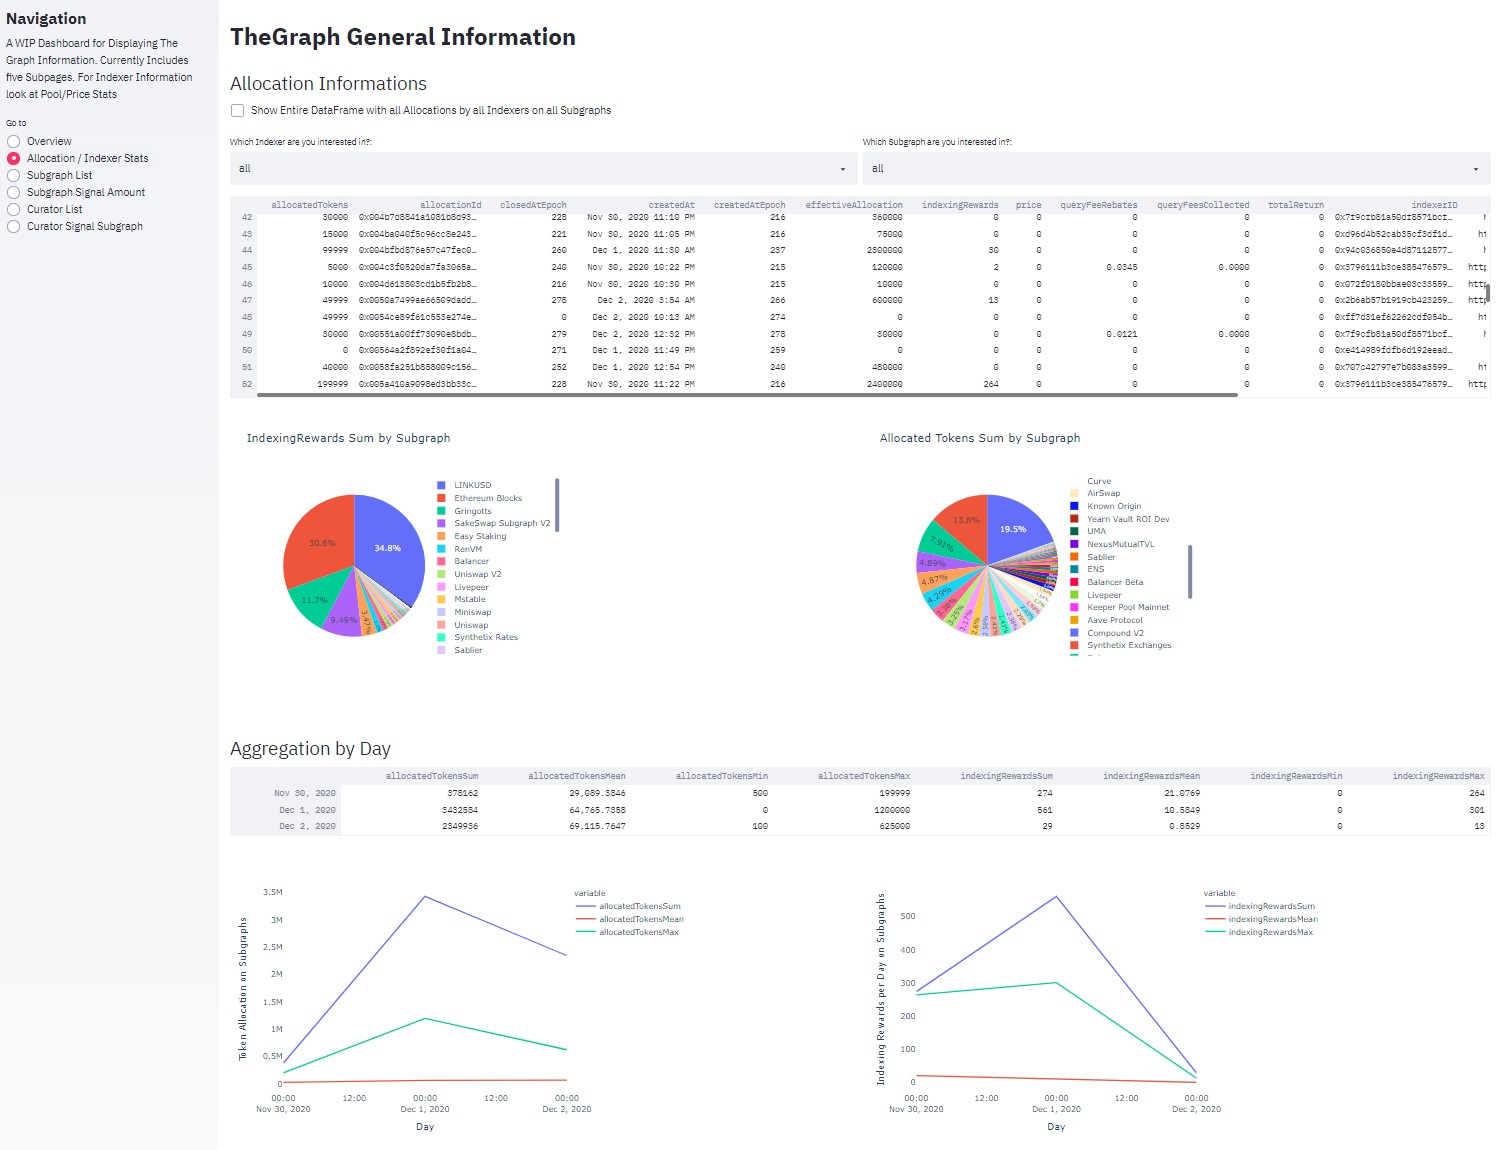
- Indexer (List of Indexer, Allocations, Indexing Rewards, Plots)
First it is necessary to install the required paackages, such as pandas, streamlit...
pip install streamlit, pandas, plotlyNow clone this repository:
git clone anyblockanalytics/thegraph-curator-phase3
After that, go into the directory of the cloned repository and run streamlit in the terminal:
streamlit run main.py
We are open for contributions and suggestions for improving this dashboard. It is still WIP. All GraphQL queries can be found in queries.py. This is build using streamlit with selfcontaining subpages.