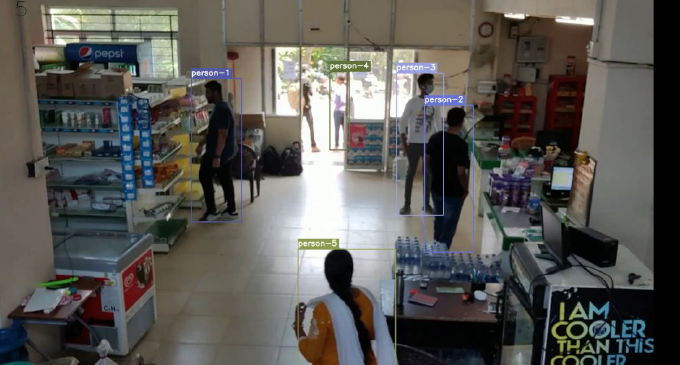
AI technologies have been on the rise and been applied to various commercial domains. With recent advancements in video processing technology, we can now record subtle human behavior in a retail shop setting, which is crucial for business management. Customer behavior, when combined with specific demographic data, provides considerably more relevant business intelligence insights to the retail industry. It is key area for any retail scenario as shopping experience plays a vital role in ensuring the success of the company in the context of retail. Besides, it also helps predict which time of the day, a particular store is crowded, composition of male/female population visiting the store, predicting the preference of the customers and subsequently placing advertisements. In our work, we would be working on keeping track of real-time footfall analysis, demographic analysis on the basis of customer age groups and gender detection, traffic detection in particular sections of the shop and motion heatmaps to highlight the areas with the most customer traffic activity (i.e., hot zones). At the end of the work, the results generated suggested that the proposed system could be effectively employed in order to effectively support the analysis of customer experience in the context of retail.
The main objective of this work is to support the retailers in devising effective strategies by supporting their decisions with the required insights or data. Video analytics provides technical solutions to queries like "How many people visited my store today/this week/this month?" or "How many customers exhibited interest in the item on sale?". Information offers retailers with useful insights that allows them to enhance merchandising/marketing and improve the consumer experience, resulting in increased profitability. Footfall analysis is a crucial metric for retailers because it enables them to compute the store conversion rate (i.e., the percentage of visitors converted to buyers). The conversion rate is an important metric for retailers because it indicates how well a store is functioning. By having knowledge on hot zones, Store managers can optimize the layout of their stores for better product placement. This information can also be used to assess or improve the performance of sales or advertising displays.
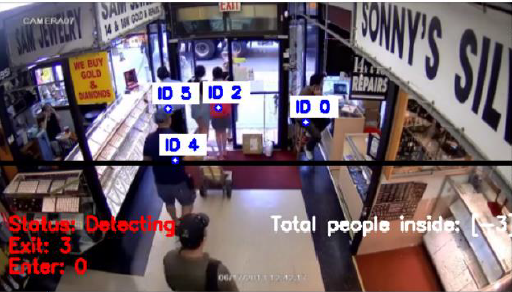
We'll be tracking people's footfall at a retail store in this module. It would offer detailed statistics on the number of persons seen at various time intervals. Many shops are missing critical data points such as precise counts of consumer foot traffic at any one time and knowing how customers move across a store. These kinds of data may be used to improve not only product placement in stores, but also personnel levels and even safety. Retailers may also acquire the peak hours of consumer visits in the shop using this data. These data may then be used to augment store inventory planning, product placement strategy, better evaluate personnel needs, and even guarantee that the number of consumers in the shop does not exceed the legal limit. These insights may also be used to examine regular travel patterns, fine-tune staffing to account for peaks and troughs in foot traffic, and learn how external variables like as holidays and weather affect foot traffic.
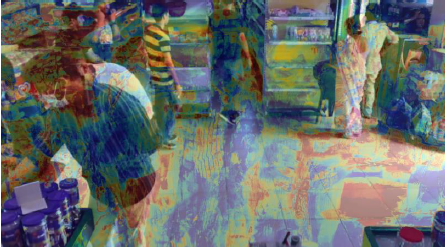
The heat maps depict the business, establishment, or public location where the most people have passed. It is used to examine consumer traffic patterns in a retail establishment. It enables us to identify the parts of the shop where our consumers pass, pause, and pay closer attention, as well as the so-called "dead zones of the store," or regions where customers do not normally pass. In the form of a colour density heatmap, it shows where the most traffic is focused in the business. The software creates a heat map using these data, with the red tones indicating the areas with the most traffic and high consumer attention, the orange areas a medium-high attention, the green areas a medium-low attention, the areas blue low attention, and the unpainted areas indicating the dead zones, where consumers practically do not pass. Retailers may use these figures to better understand how to optimise product positioning and the efficacy of promotional displays.
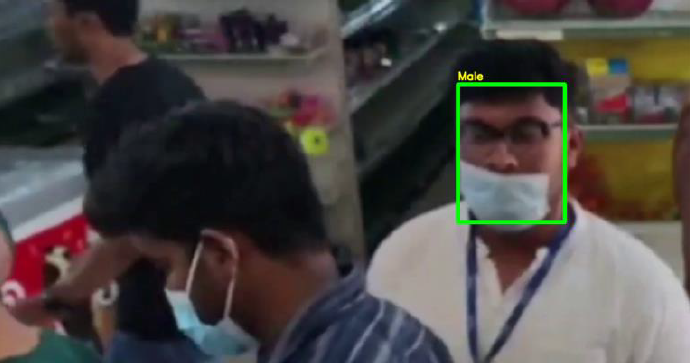
In this module, we will examine the demographic information of people in a retail store. Because customer demographics primarily dictate their preferences, identifying and utilizing customer gender information in sales forecasting may maximize retail sales. We would draw a box around the people and indicate their gender. This would aid in the promotion of gender-based marketing. Gender marketing can be successful if individuality and diversity are considered, which this module will do so by collecting gender information about purchased products.
In this module, we would count the number of people in a retail store in a specific section at a specific time. It would provide detailed analytics on the number of people visible at various time intervals in various sections. Using this information, retailers can determine the peak hours for customer visits to a specific section. It will not only assist owners in product management in various sections, but it will also assist them in better advertising different products. It would also provide information on the sales of various products at different times of day, which would aid in the better management of products with a short shelf life.