Please Note : The dataset provided for learning purpose.And this is a startup project at junior level.
-
Programing, Python
-
Colab, platform to collaborate
-
Deployment, Streamlit
Its important to know price of a car roughly before selling or buying it.For car price prediction,we used data which obtained from "autoscout.nl" and searched some information about how the prices vary with those features (variables,columns). We aim to create an interactive online interface ,where the users can enter the features about a particular car to have an idea about its market price. This interface will use our machine learning model for prediction in the background.
This data obtained from "autoscout.nl".Dataframe (df) has 71104 records(rows), 49 features(columns),size 110 MB. Almost all columns explained briefly below. At the end of EDA processes ,69510 rows,160 columns,size 85MB.
province :Shows where car sell from
make_model :Brand and model
vehicle_age :Vehicle age
drivetrain :Shows where is the engine power
non_smoker_vehicle :Smoke in car or no
empty_weight :The vehicle's weight without passenger
mileage :Total traveled distance
co2_emissions :Carbondioxide emission amount (g/km)
doors :Number of doors of the vehicle
gears :Number of gears of the vehicle
colour :Colour of the vehicle
upholstery :Upholstery type of vehicle -cloth,leather
combination (L/100Km) :Avarage fuel consumption
Safety&Security :Features for safety&security for exp;Central door lock,Driver-side airbag
price :Price of vehicle
seller :Who is selling,private or galery
location :Location of vehicle
power :Shows engine power in cc or kwh
seats :Number of total seats of vehicle
warranty :Warranty by galery or seller -month
general_inspection :Shows whether vehicle need inspection
previous_owner :Who was previous owner
engine_size :Hows size of vehicle engine in cc or kwh
Fuel_type :What fuel(or whether electric) type vehicle needs -Gasoline,Diesel,electric
upholstery_colour :Colour of upholstery -Black,brown
Comfort&Convenience :Systems ,features like -'Air conditioning','Navigation system','Power windows'
make :Brand of car -BMW,renault ...
gearbox :Type of gear -automatic, manual
emission_class :The Euro emissions standards, from Euro 1 to Euro 6
short_description :Cars description by seller
type :New, used
country_version :Cars country version(Esp,NL)
first_registration :When the car registered "month/year"
full_service_history:Used throughout the pre-owned car market, and shows that a vehicle has been well maintained -yes,no
cylinders :How many cylinders powering the car -4,6,8
joblib==1.1.0
lightgbm==2.2.3
numpy==1.21.4
pandas==1.3.4
scikit-learn==1.0.2
streamlit==1.8.1
data = pd.read_csv('/content/drive/MyDrive/Colab Notebooks/autoscout_data_2000.csv') df = data.copy()
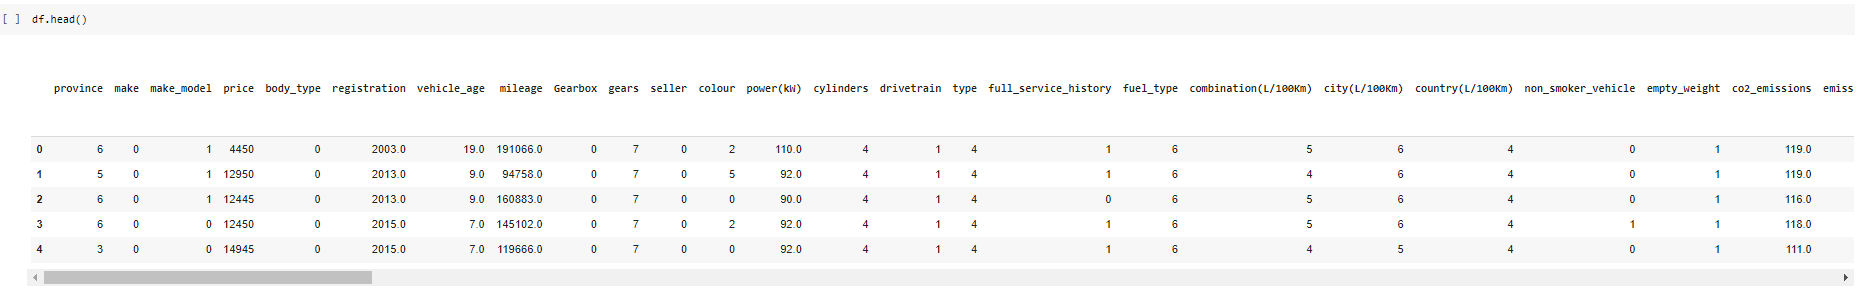
Here initial dataframe
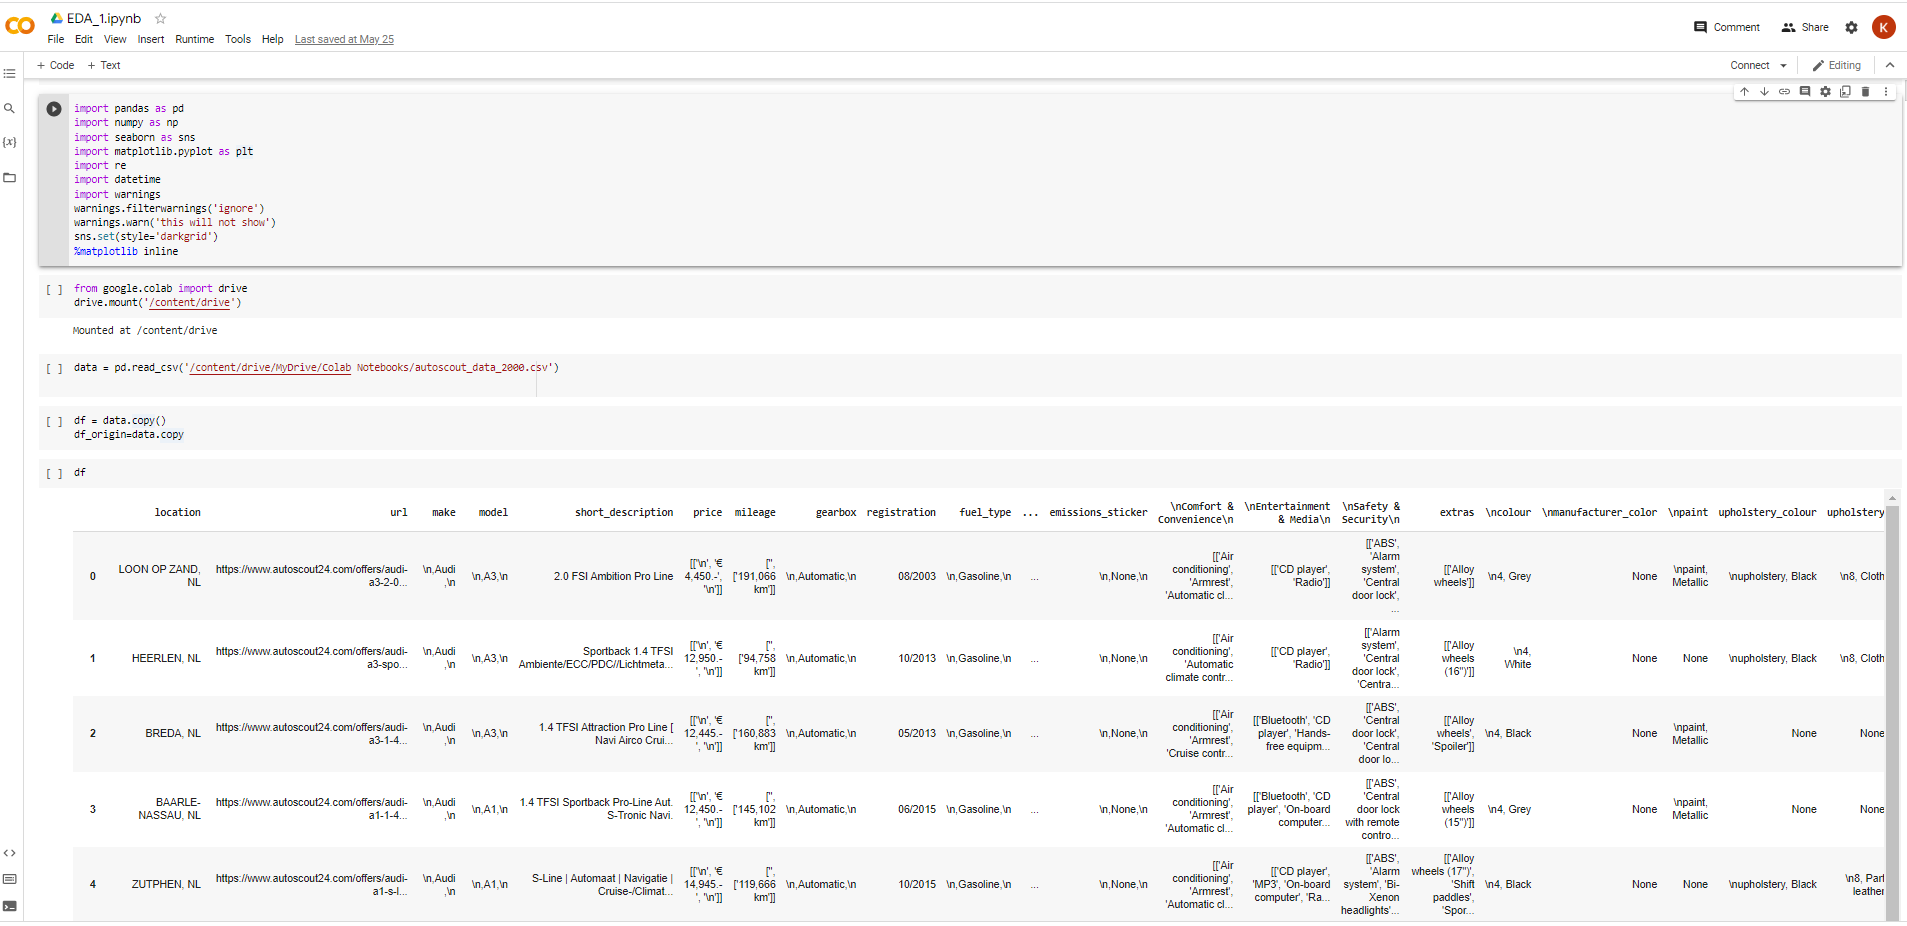
Dataframe was in "csv" format.This caused some issues during saving and reloading processes(caused broken records). We converted "csv" to "pickle" which works flawlessly.
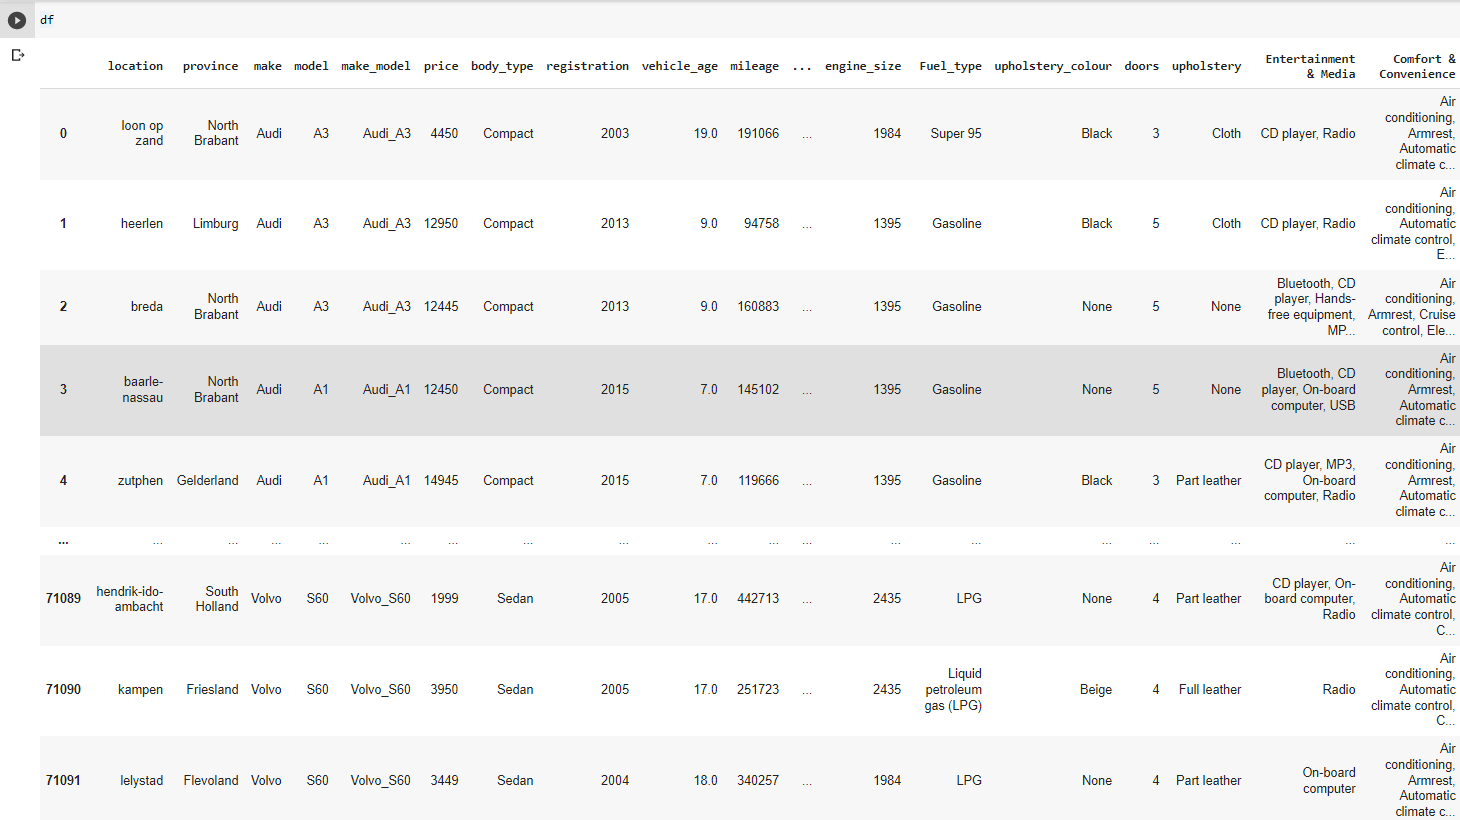
Columns had messy information,used regular expression in python.
df['engine_size']=df['engine_size'].str.replace(r'[^0-9]+', ‘’)
We realized that 10 unpair records was broken and some ,deleted those records. Some records are meaningless in DF . Firtsly ,we searched for domain knowledge to distinguish whether they are meaningful. They are not real values ,might be entered by users mistakenly.
If filling them with functions is accurate, convert those values to NaN values then fill them again. If it doesnt worth to deal,just drop. Here some examples: -empty_weight<500 kg -price>10000000 € -engine_power<50 kW
- Added province feature, according to location feature,used another csv data which obtained from another website to derive province feature.
- Unified make(brand) and model columns,makes more sense for filling nan values , same models have similar features.
- Derived new features for more readable features,just optional, vehicle_age.
NaN values filled with the proper functions such as "fill_most".We have several pre-prepared functions ,such as fill() ,fill_prop(), fill_most(), which can be seen in EDA_2 file.
- Converted data dtype(all data types were string) to the most proper data type for that particular feature.For instance: engine size 2000cc(string) to 2000(integer).
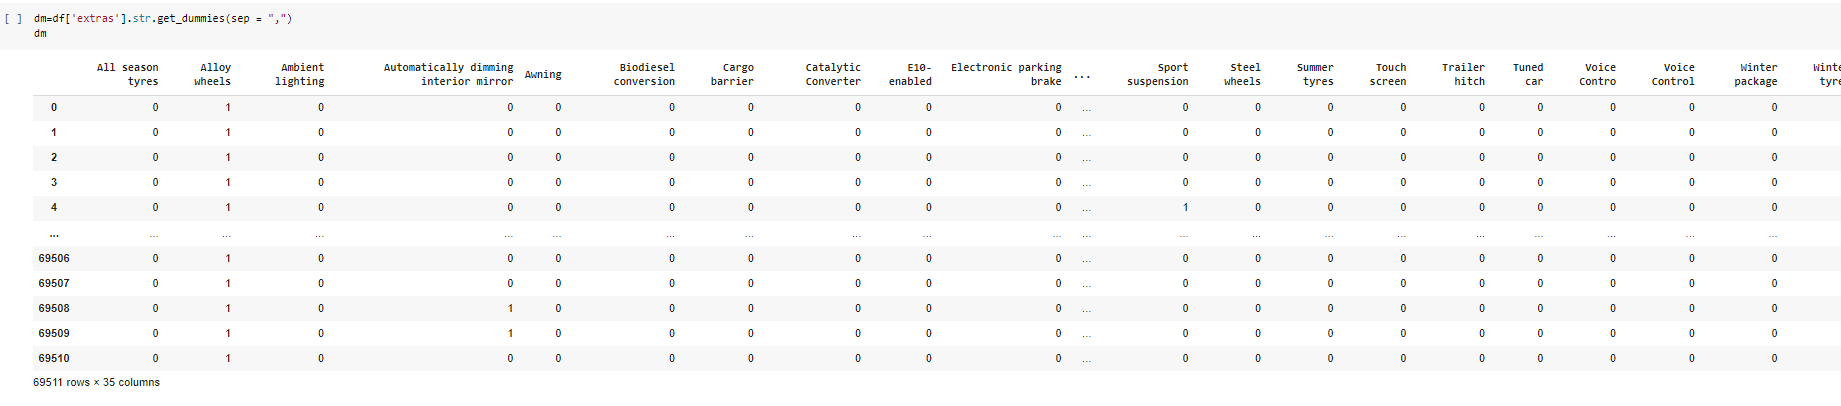
- Use "get_dummies" function to extract variables from "Safety & Security,Comfort & Convenience".The get_dummies function is used to convert categorical variables into a value of 0 or 1.This is more proper for ML model. Note:There was some dublicated names -like control and contro appear like different features due to one letter difference-. renamed the incorrect names to merge the correct names(in this instance "contro" merged in "control" ,to avoid duplication).
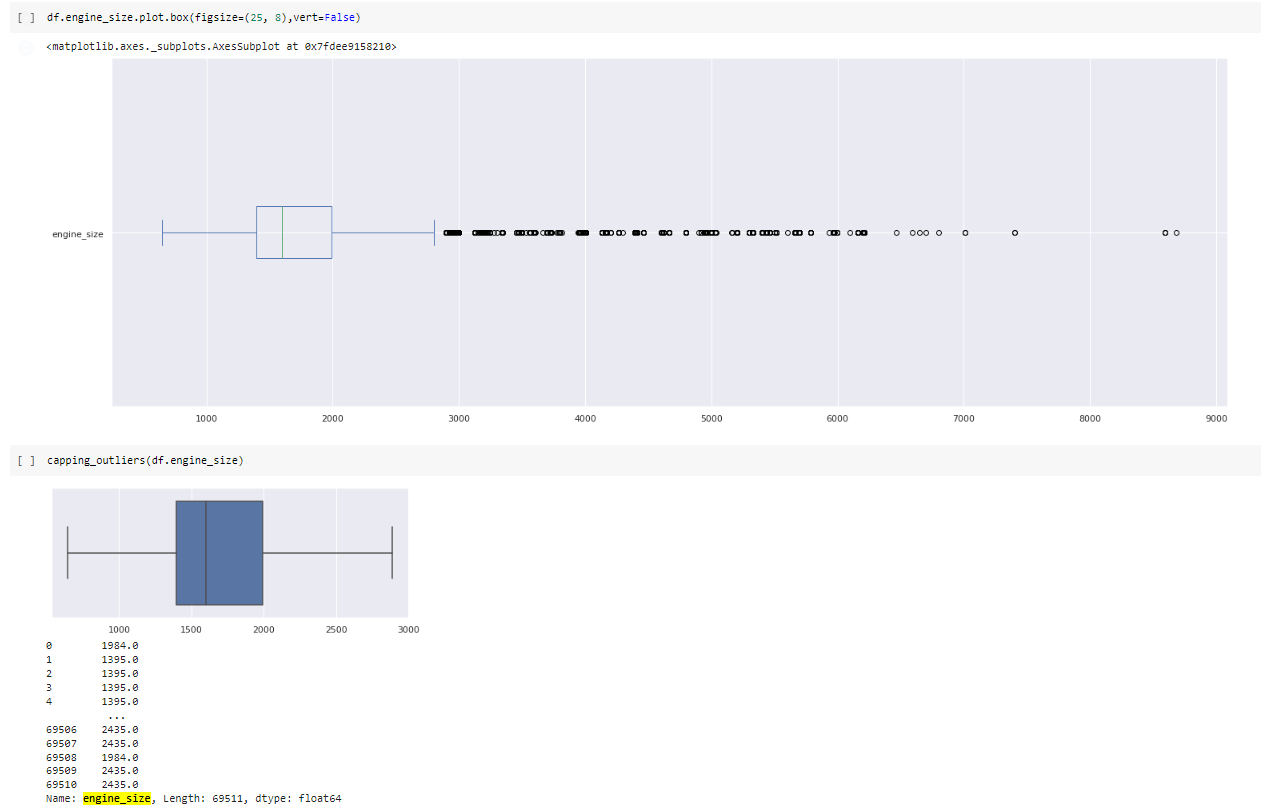
You can check EDA_3 to see which functions we used for replace_outliers(), outliers(), capping_outliers().
- Used some visualization tool and deal with outliers by using functions which indicated before. Additionally during visualization,colab needed upgrade matplotlib,for better visualization.
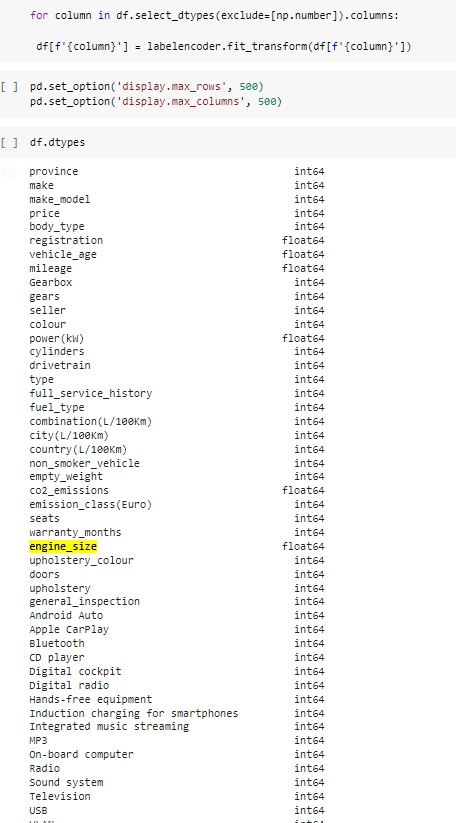
Applied label encoding to convert non-numeric values to numerics for ML model.
 from sklearn.preprocessing import LabelEncoder
 labelencoder = LabelEncoder()
 for column in df.select_dtypes(exclude=[np.number]).columns:
         df[f'{column}'] = labelencoder.fit_transform(df[f'{column}'])
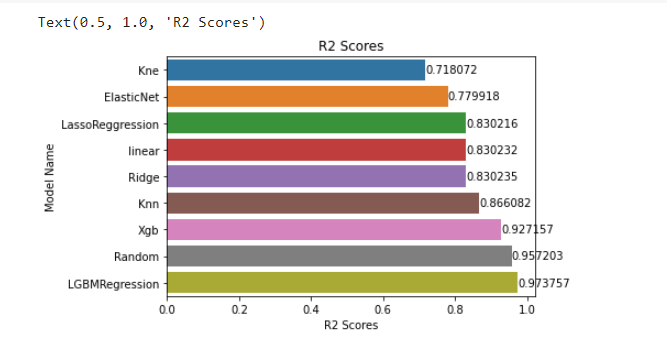
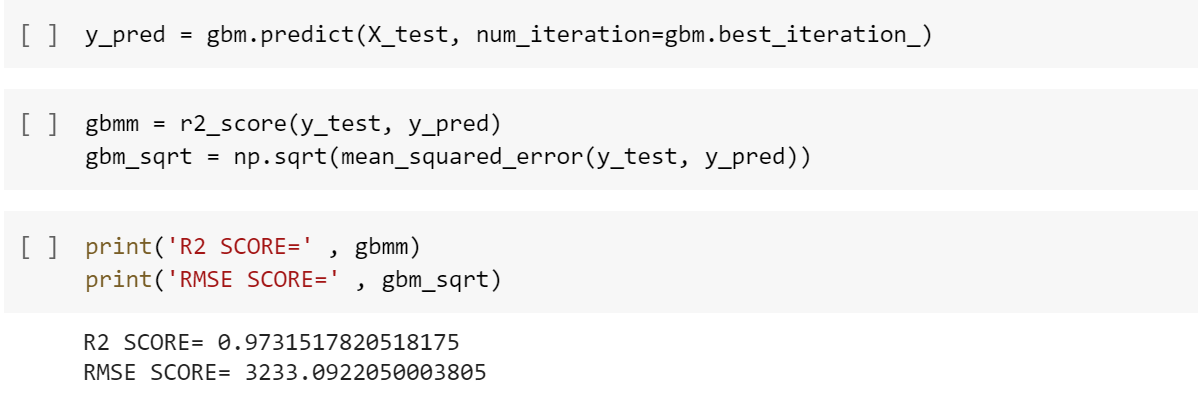
- Tried to find out which is the best ML model for our dataset,compare R2 and RMSE values.
- Tested some models,such as Lasso(), KNeighborsRegressor(), LightGBM(), and decided on LGBM ,one of the newest popular model.
- Focused on what we can do for a better result.
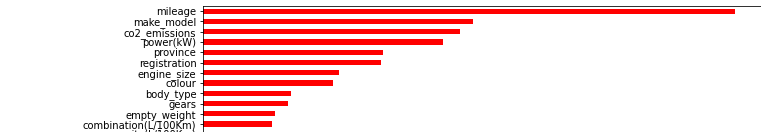
- Variable importance refers to how much a given model uses that variable to make accurate predictions.
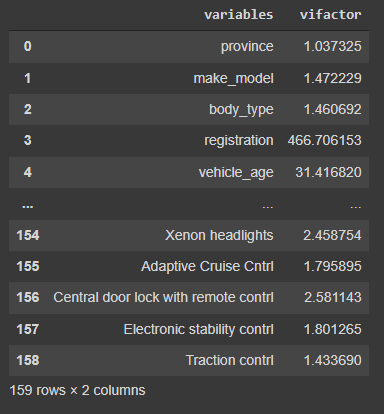
- Multicollinearity occurs when there is a high correlation between the independent variables in the regression analysis which impacts the overall interpretation of the results. It reduces the power of coefficients.Aware of that you need leave at least one of those similar features,if you delete all,ML model cant use that feature to predict similar features.It doesnt affect predictions result.We show "vif values" here and drop to avoid multicollinearity.
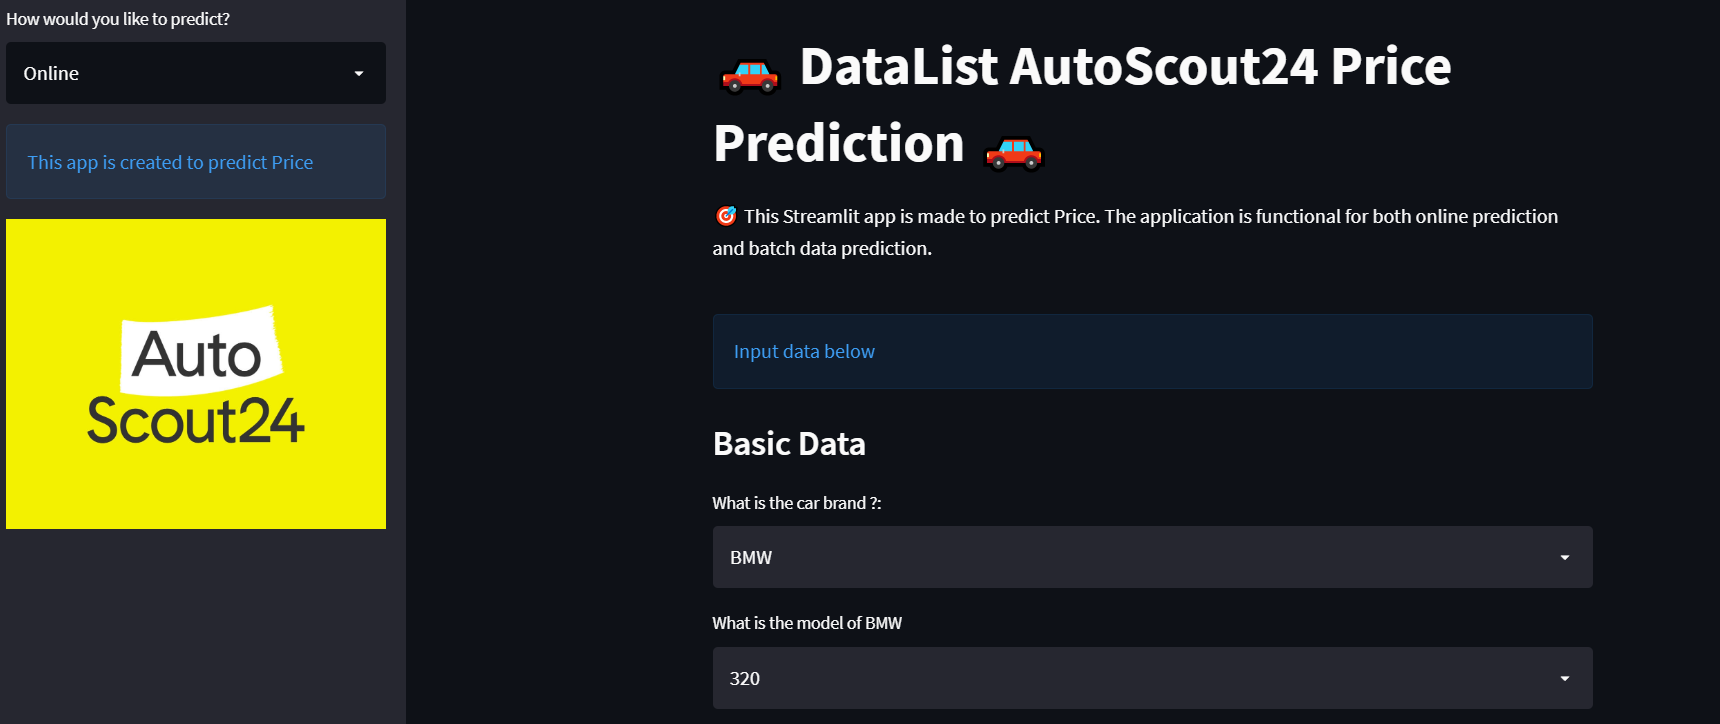
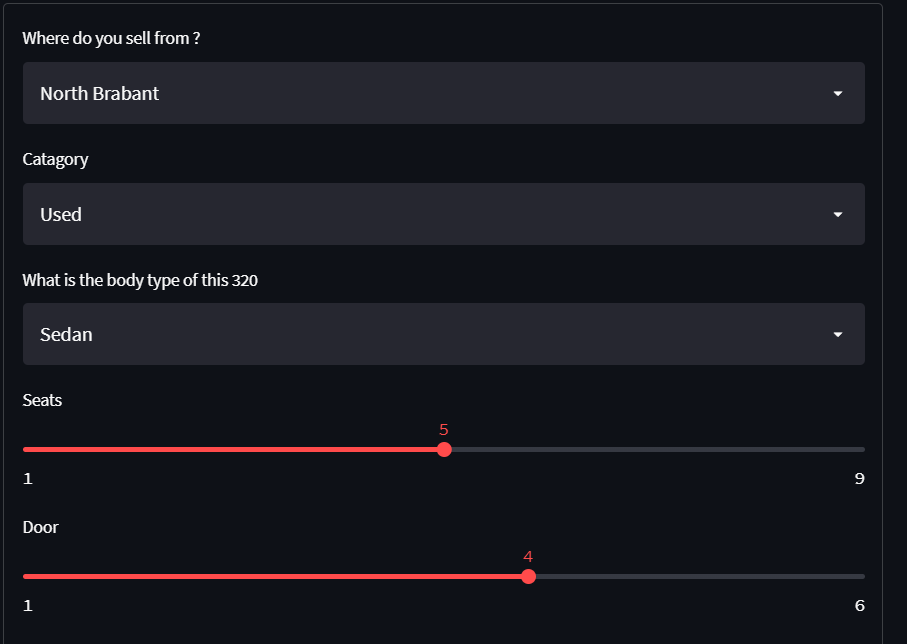
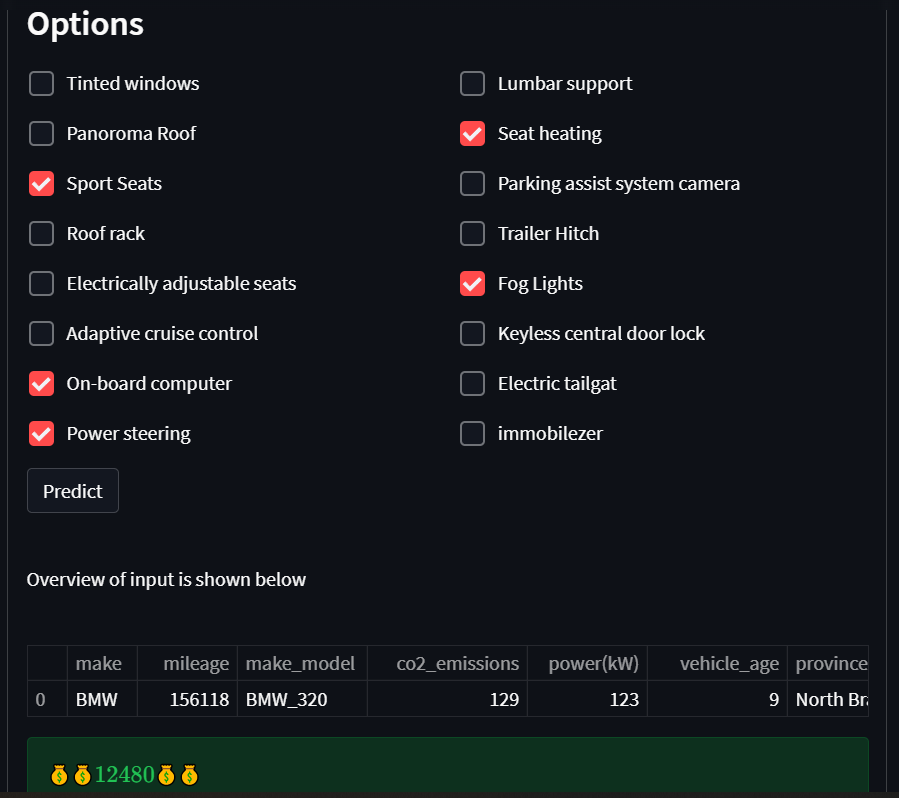
- For interactive interface,the users must fill those features manually to predict price of a particular car. But here it automatically fills all features according to the most frequent features of this brand/model("make_model" column).Then the users can change features themselves.So it takes less time to fill default values.
Try to DEMO
*Streamlit screenshots * :
Link for EDA_1
Link for EDA_2
Link for EDA_3
Link for ML-Colab