-
Notifications
You must be signed in to change notification settings - Fork 5
New issue
Have a question about this project? Sign up for a free GitHub account to open an issue and contact its maintainers and the community.
By clicking “Sign up for GitHub”, you agree to our terms of service and privacy statement. We’ll occasionally send you account related emails.
Already on GitHub? Sign in to your account
differences in pvalues after updating methylSig #43
Comments
|
Hi, I edited your comment above to make it a bit easier for me to read and locate the pertinent information. What I'm hearing is you ran the same data set through the old and new versions of methylSig and found:
You also mentioned "The only thing I know that was done differently was I kept the local window size 0." Since one test used local information and the other didn't, I'm not surprised the number of significant loci are different. The operations to compute test statistics and significance are the same, yes (you said "If it is the same test by default"), but by doing one test with local information and the other without, the numbers going into the computations are different, so you're going to get different results.
I would agree that it takes longer, and I'll try to work on that, but it does work in the sense that it uses the local information.
Some other relevant information to have would be:
In other words, it would be helpful to see the code that you're running to get the results you describe. |
|
This might be a very long post but I am just trying to be thorough and make sure I didn't make a mistake a long the way. I found a site that was the same between my old and new output to compare the pvalues. The old mydiffSig output is row 4. The new output is row 15. The first thing I noticed was the huge discepancy between the methylation average in cases and controls. I thought at first maybe the range was different (like comparing 0-1 v 0-100) but they can both go 1-100. The only other difference in my pipeline was that I used bsseq to import cytosine report files instead of using the bismark cov files and modifying the format myself. I wanted to rule that out that as the cause so I get the percent methylation values from each analysis for that site (rows 6 and 19) . They are identical except I had a couple of extra samples in the new output. So I don't think this is an error due to coverage files versus cytosine reports. But if you look at the averages in the old output, they align very well with what is reported in the myDiffSig output. In the new ones, they are way off. Something is very wrong here and it may be on my end but I don't know. I just saw your response above and I will attach my code. |
|
I would like to point out that this is really not a very clear example to try to figure out if a problem exists and what that problem might be. It is really important that the data be the same in the two instances and that the parameters be the same in the two instances. It is very hard to disentangle what is happening otherwise. I will use some data that I have access to, and I will run it using the same filters and the same parameters, and I will report back my findings. I will say, prior to release, I did this, and didn't notice anything strange. |
|
I am sorry that my example is not clear. I am going to run it with the exact same parameters and filters. Please let me know if there is any data I can provide. |
|
I think this repository will get to the heart of the matter. https://github.com/rcavalcante/methylsig_comparison I have provided bedGraph files (same format as bismark cov files) in the The code for the old methylSig is in That code generates rdata objects in The code to compare the data is in I created images for:
The key thing to take away is that the results are the same when comparing the same tests between old and new versions. You can see that the plots comparing old versus new without local information and old versus new with local information have points falling perfectly on the y = x line. Another thing to note is that within old and new methylSig, comparing no local information to with local information produces different results. This is expected because the underlying methylation and dispersion estimates are changed with the local information. I hope this clears up any doubts you may have had about the new and old versions. With that said, I agree that using local information has gotten slower and I'll try to find some time to fix that (I do have other priorities at work, but I am allowed some development time for this package). If you feel that this resolves your issue, please go ahead and close it. And thanks for using methylSig. |
|
As an update, I ran my data with local information. Unfortunately, I feel like my results were worse because it showed that almost 1/2 my sites were significant using FDR cutoffs. Perhaps my issue is that I was using v0.4.4 (before granges) and now I am using 0.99.1. I am not doubting your data showing no difference. I am attaching the differential methylation calculations (just 1000 rows) comparing my old output with the new output. Both are run with the exact same samples, same coverage cutoffs and using window size of 200. |
|
I will take a look at this in the next few days. I'll also run the data I included in the repo in methylSig v0.4.4. Sorry, I missed that particular detail. |
|
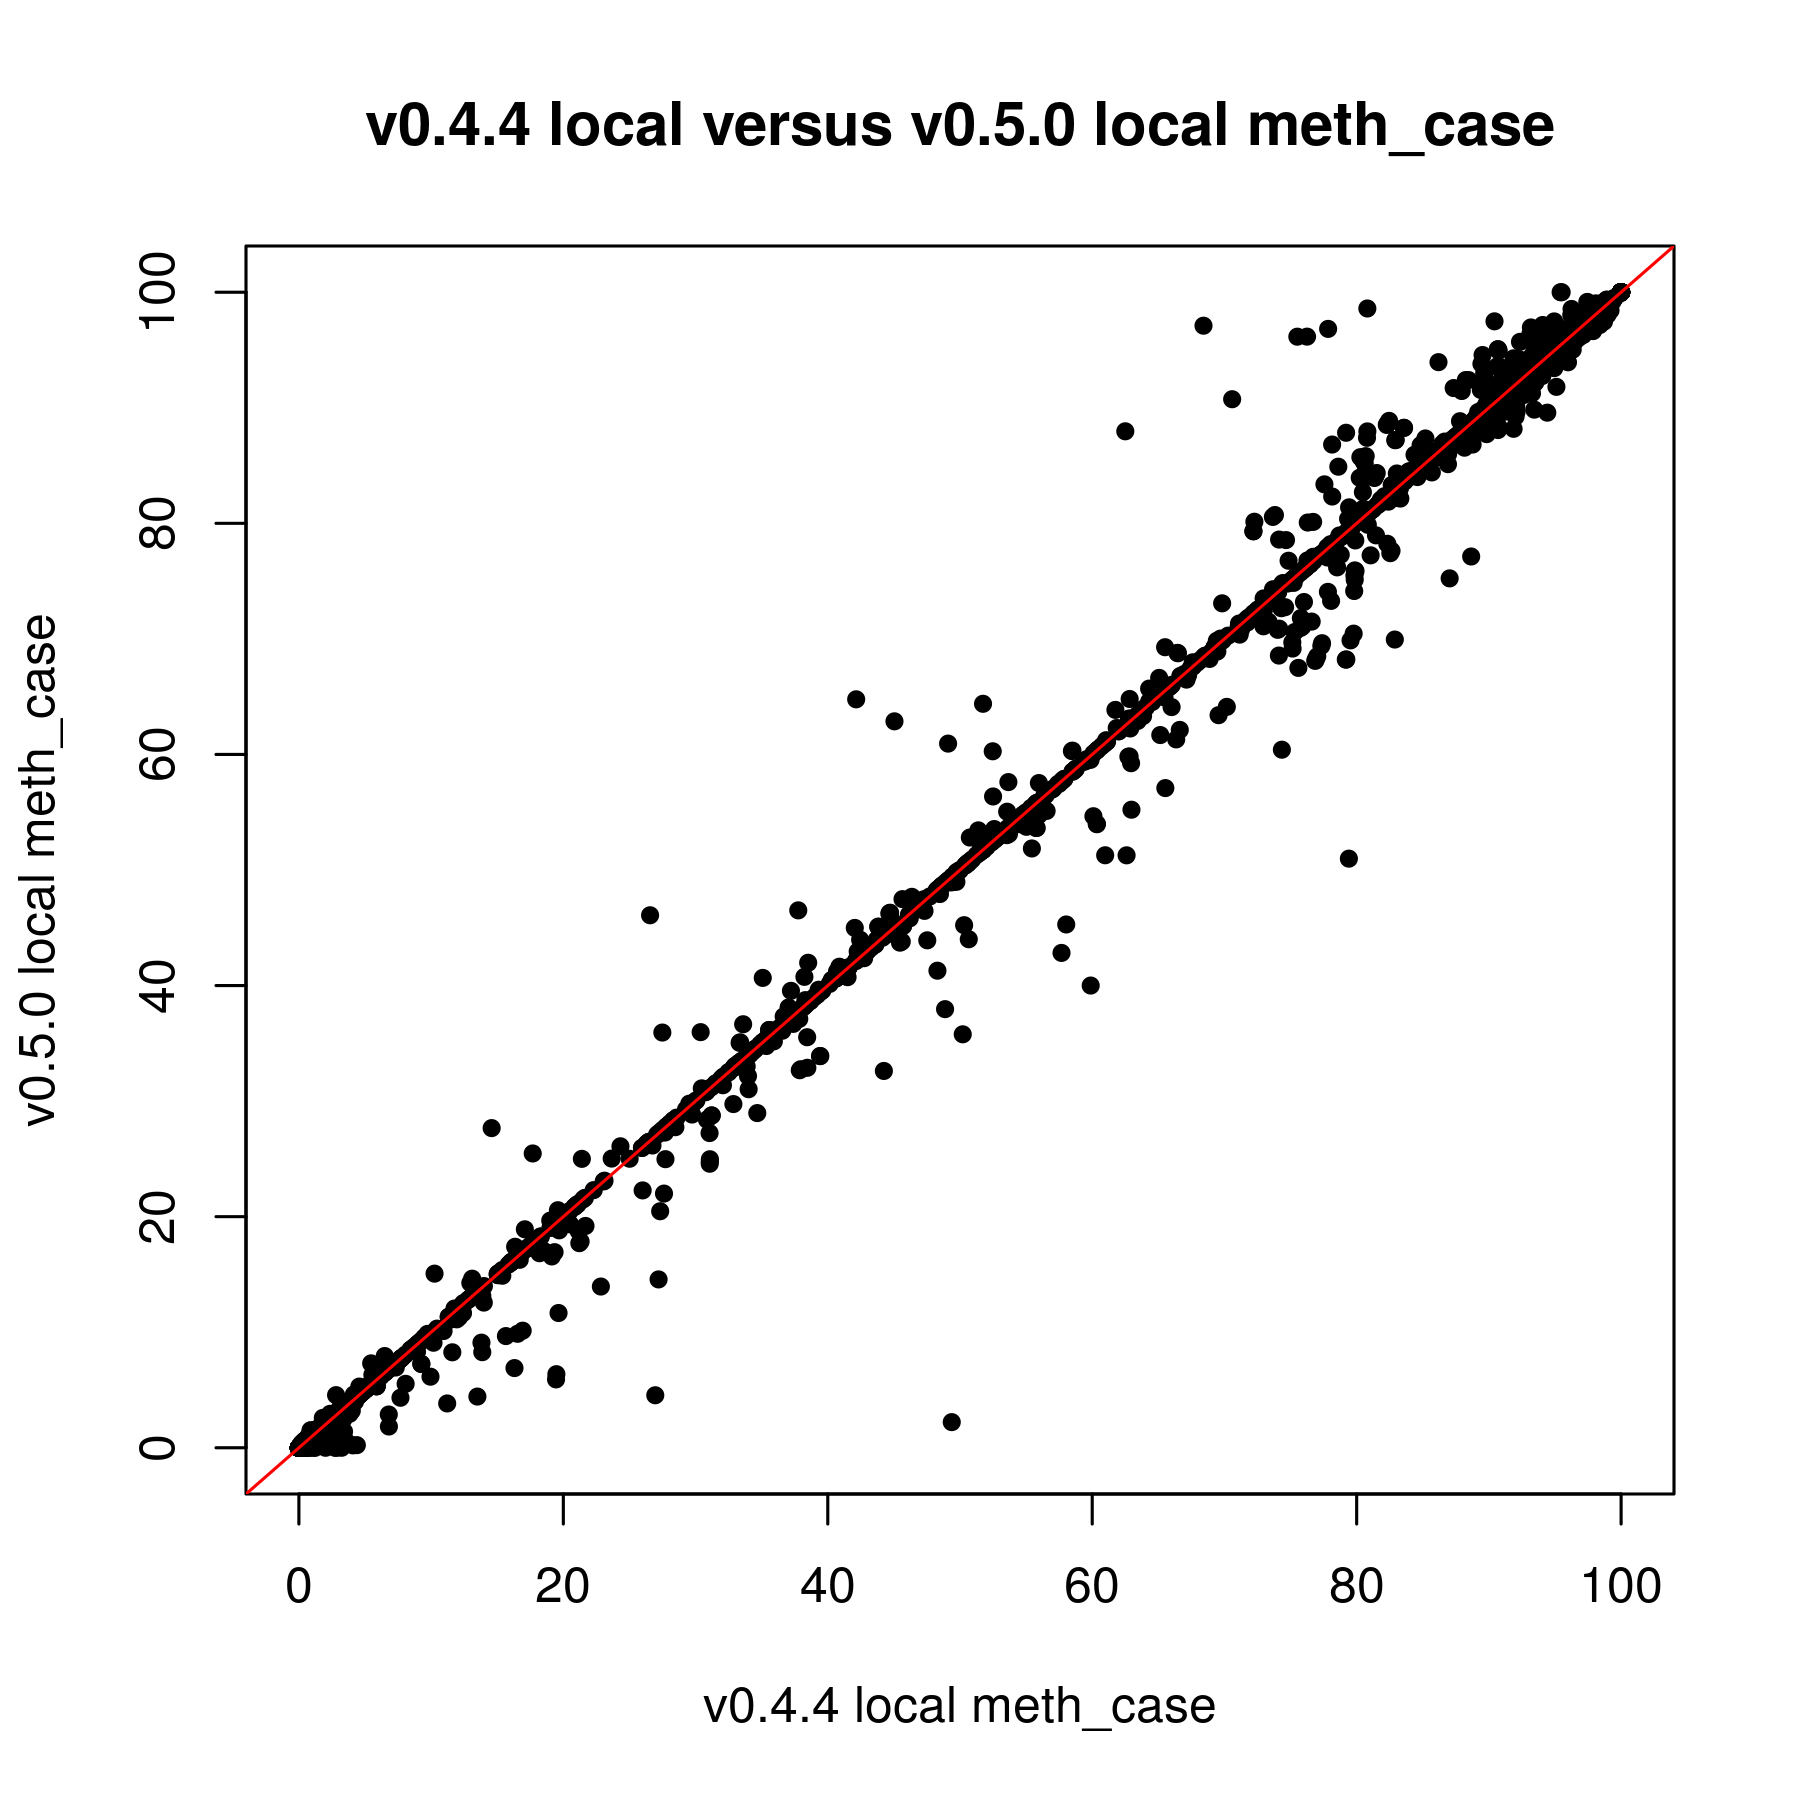
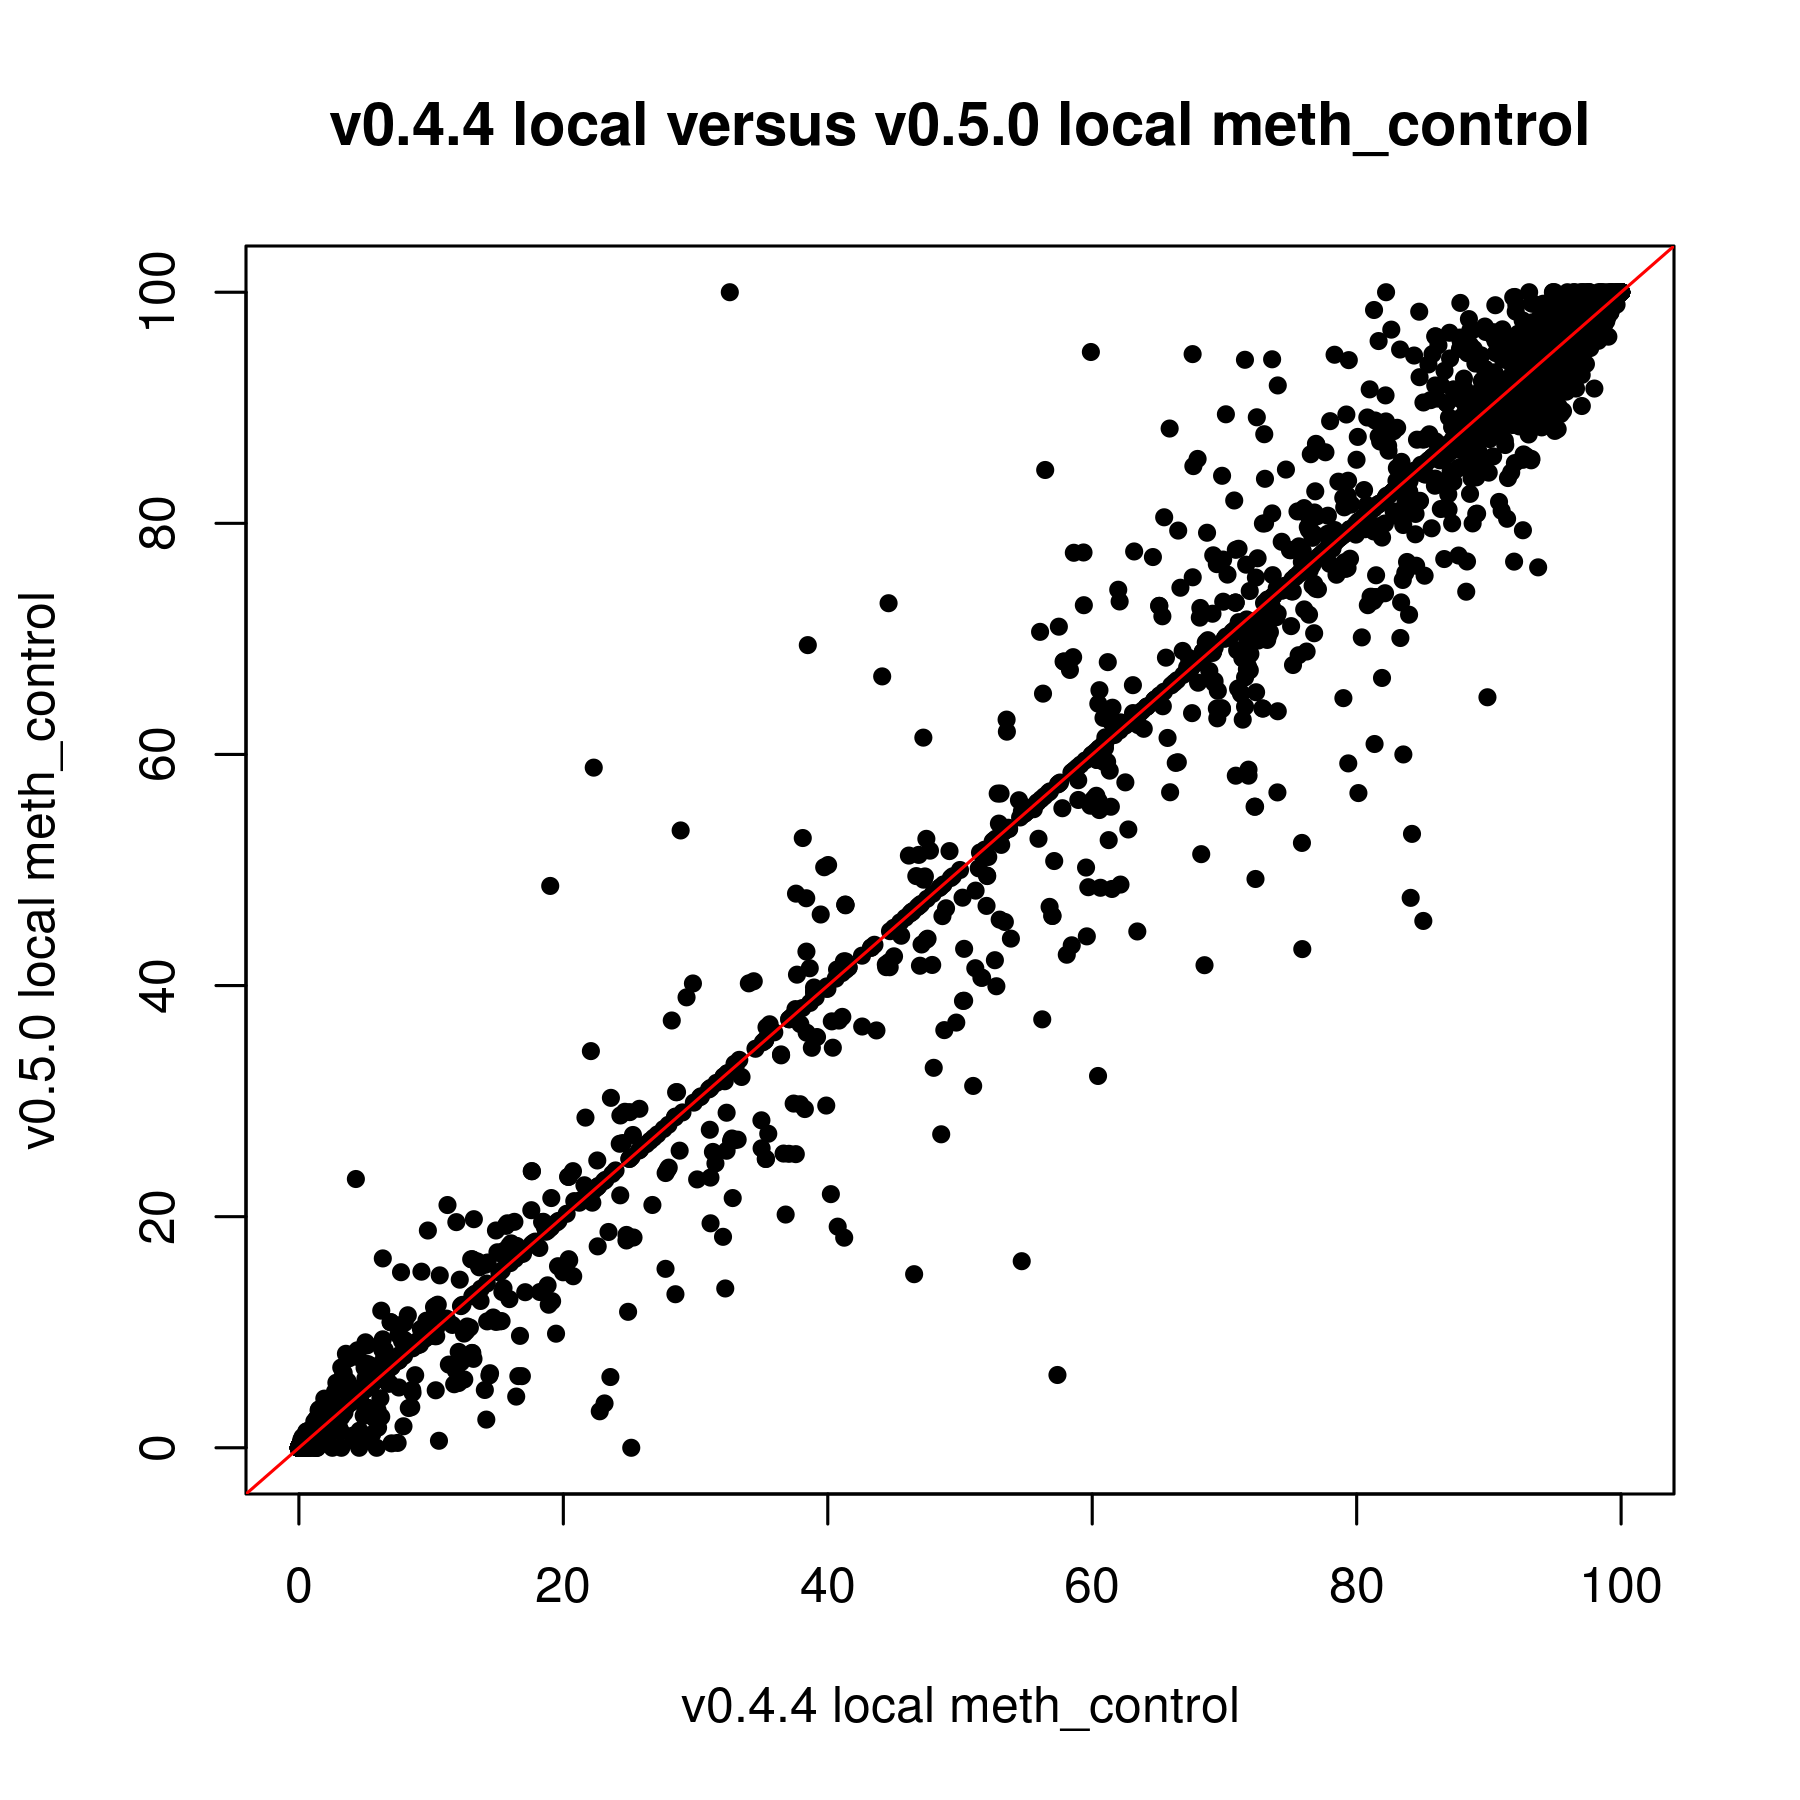
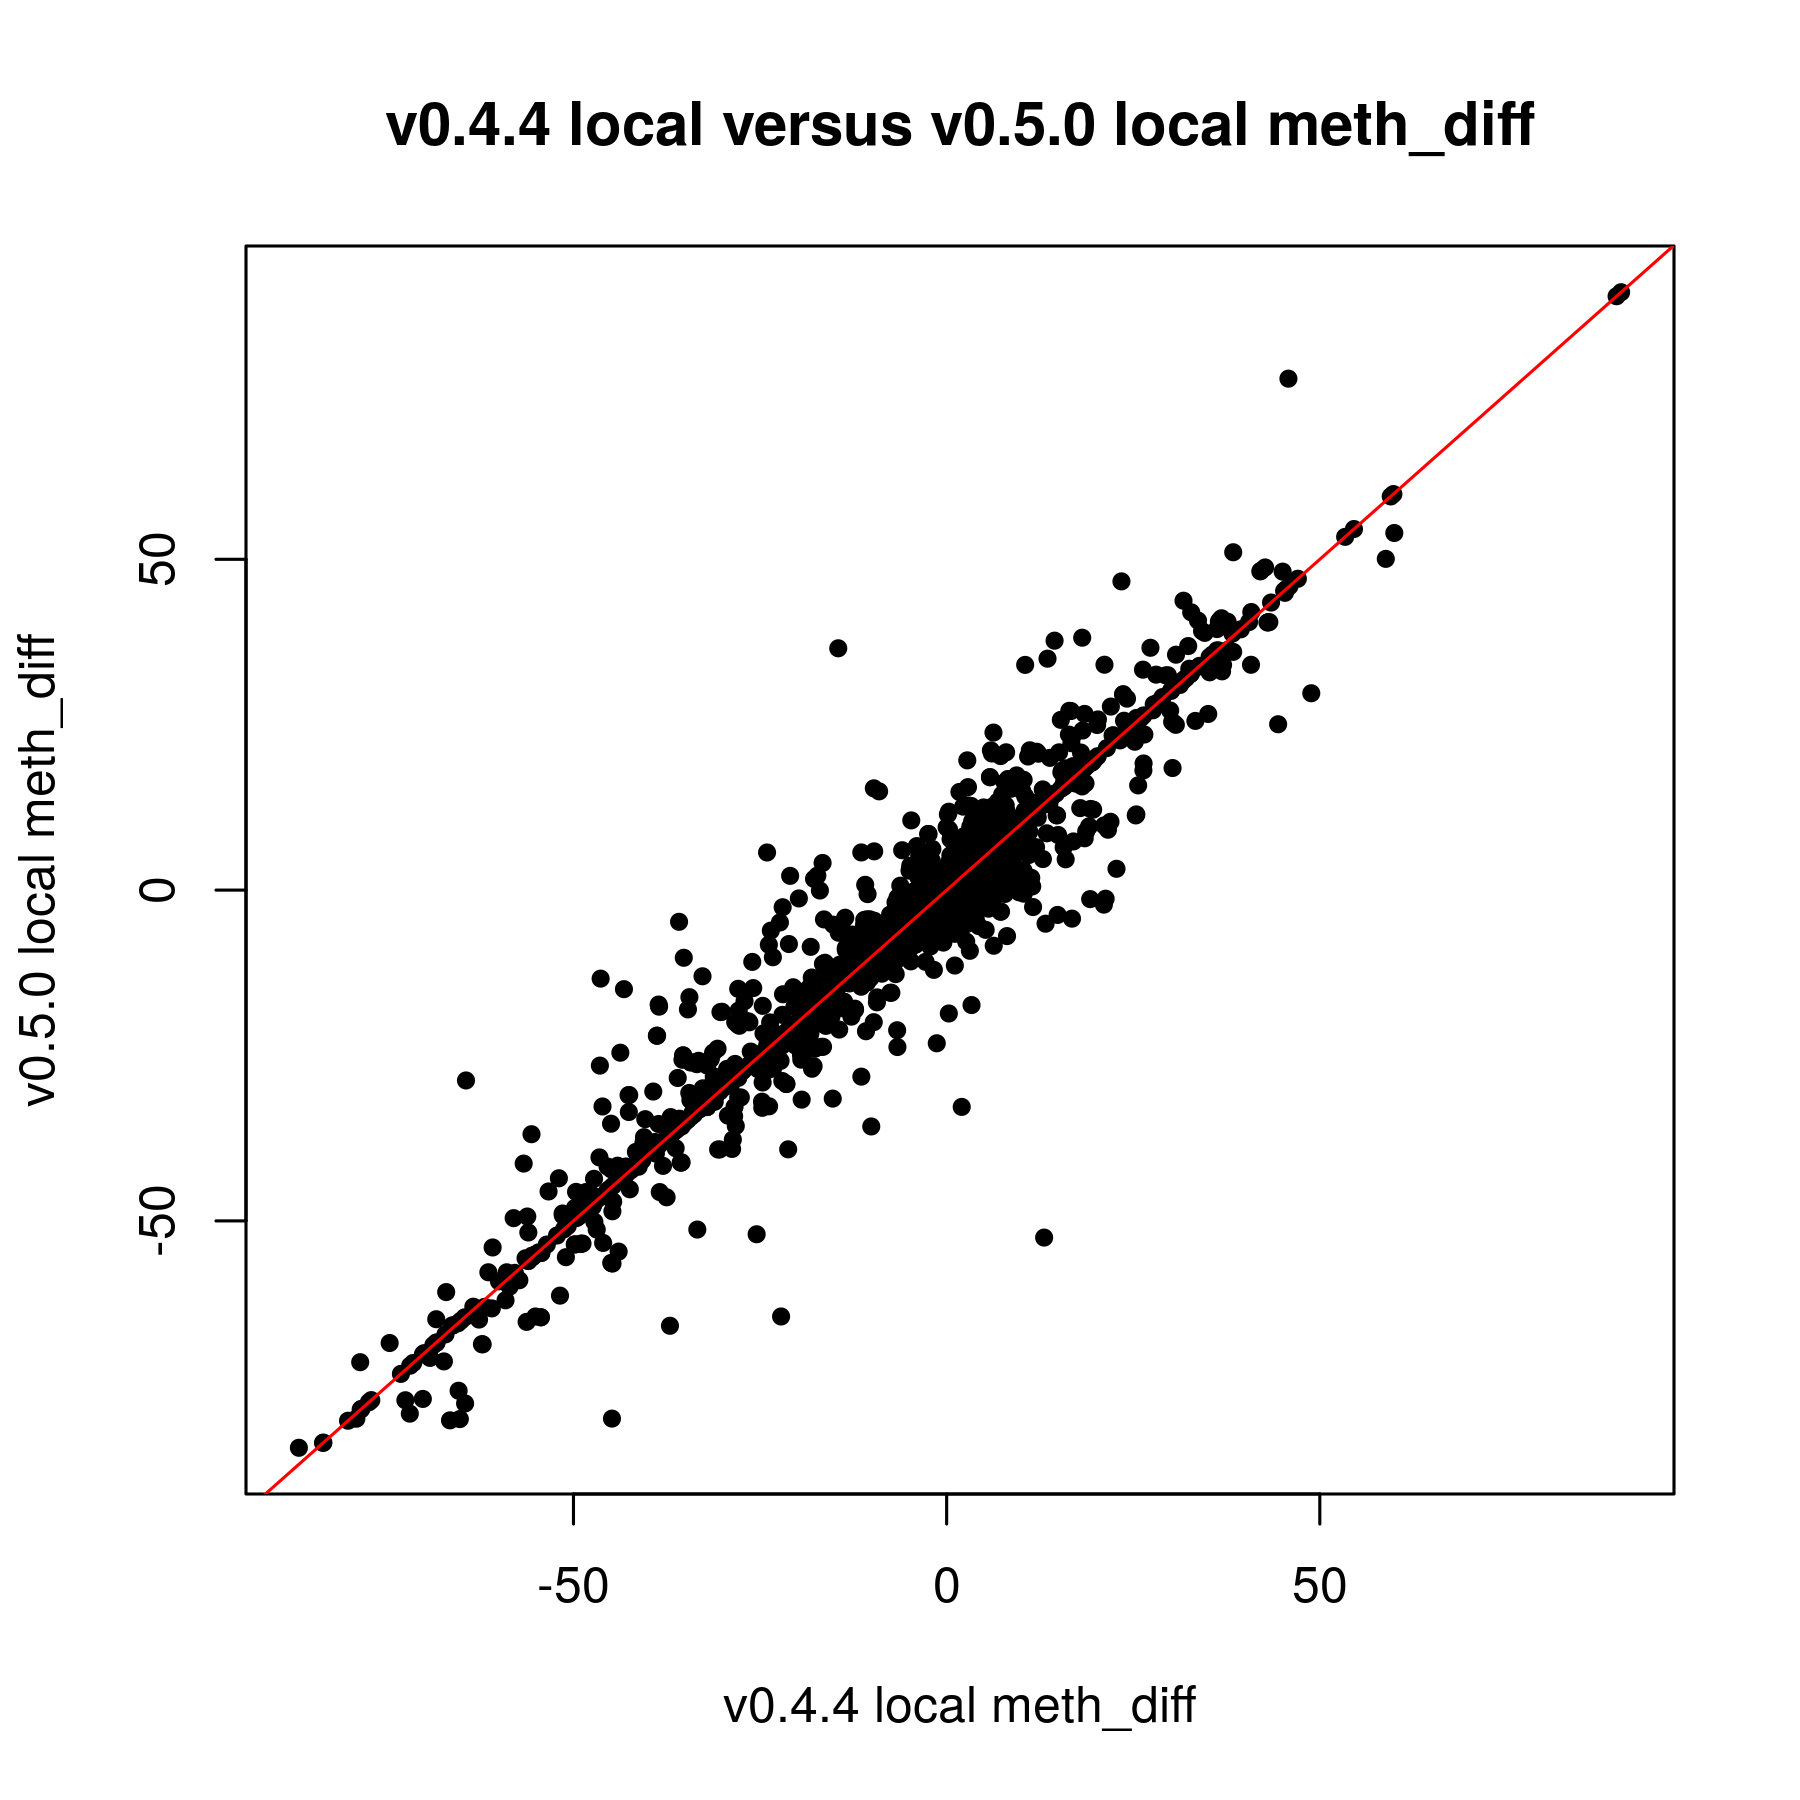
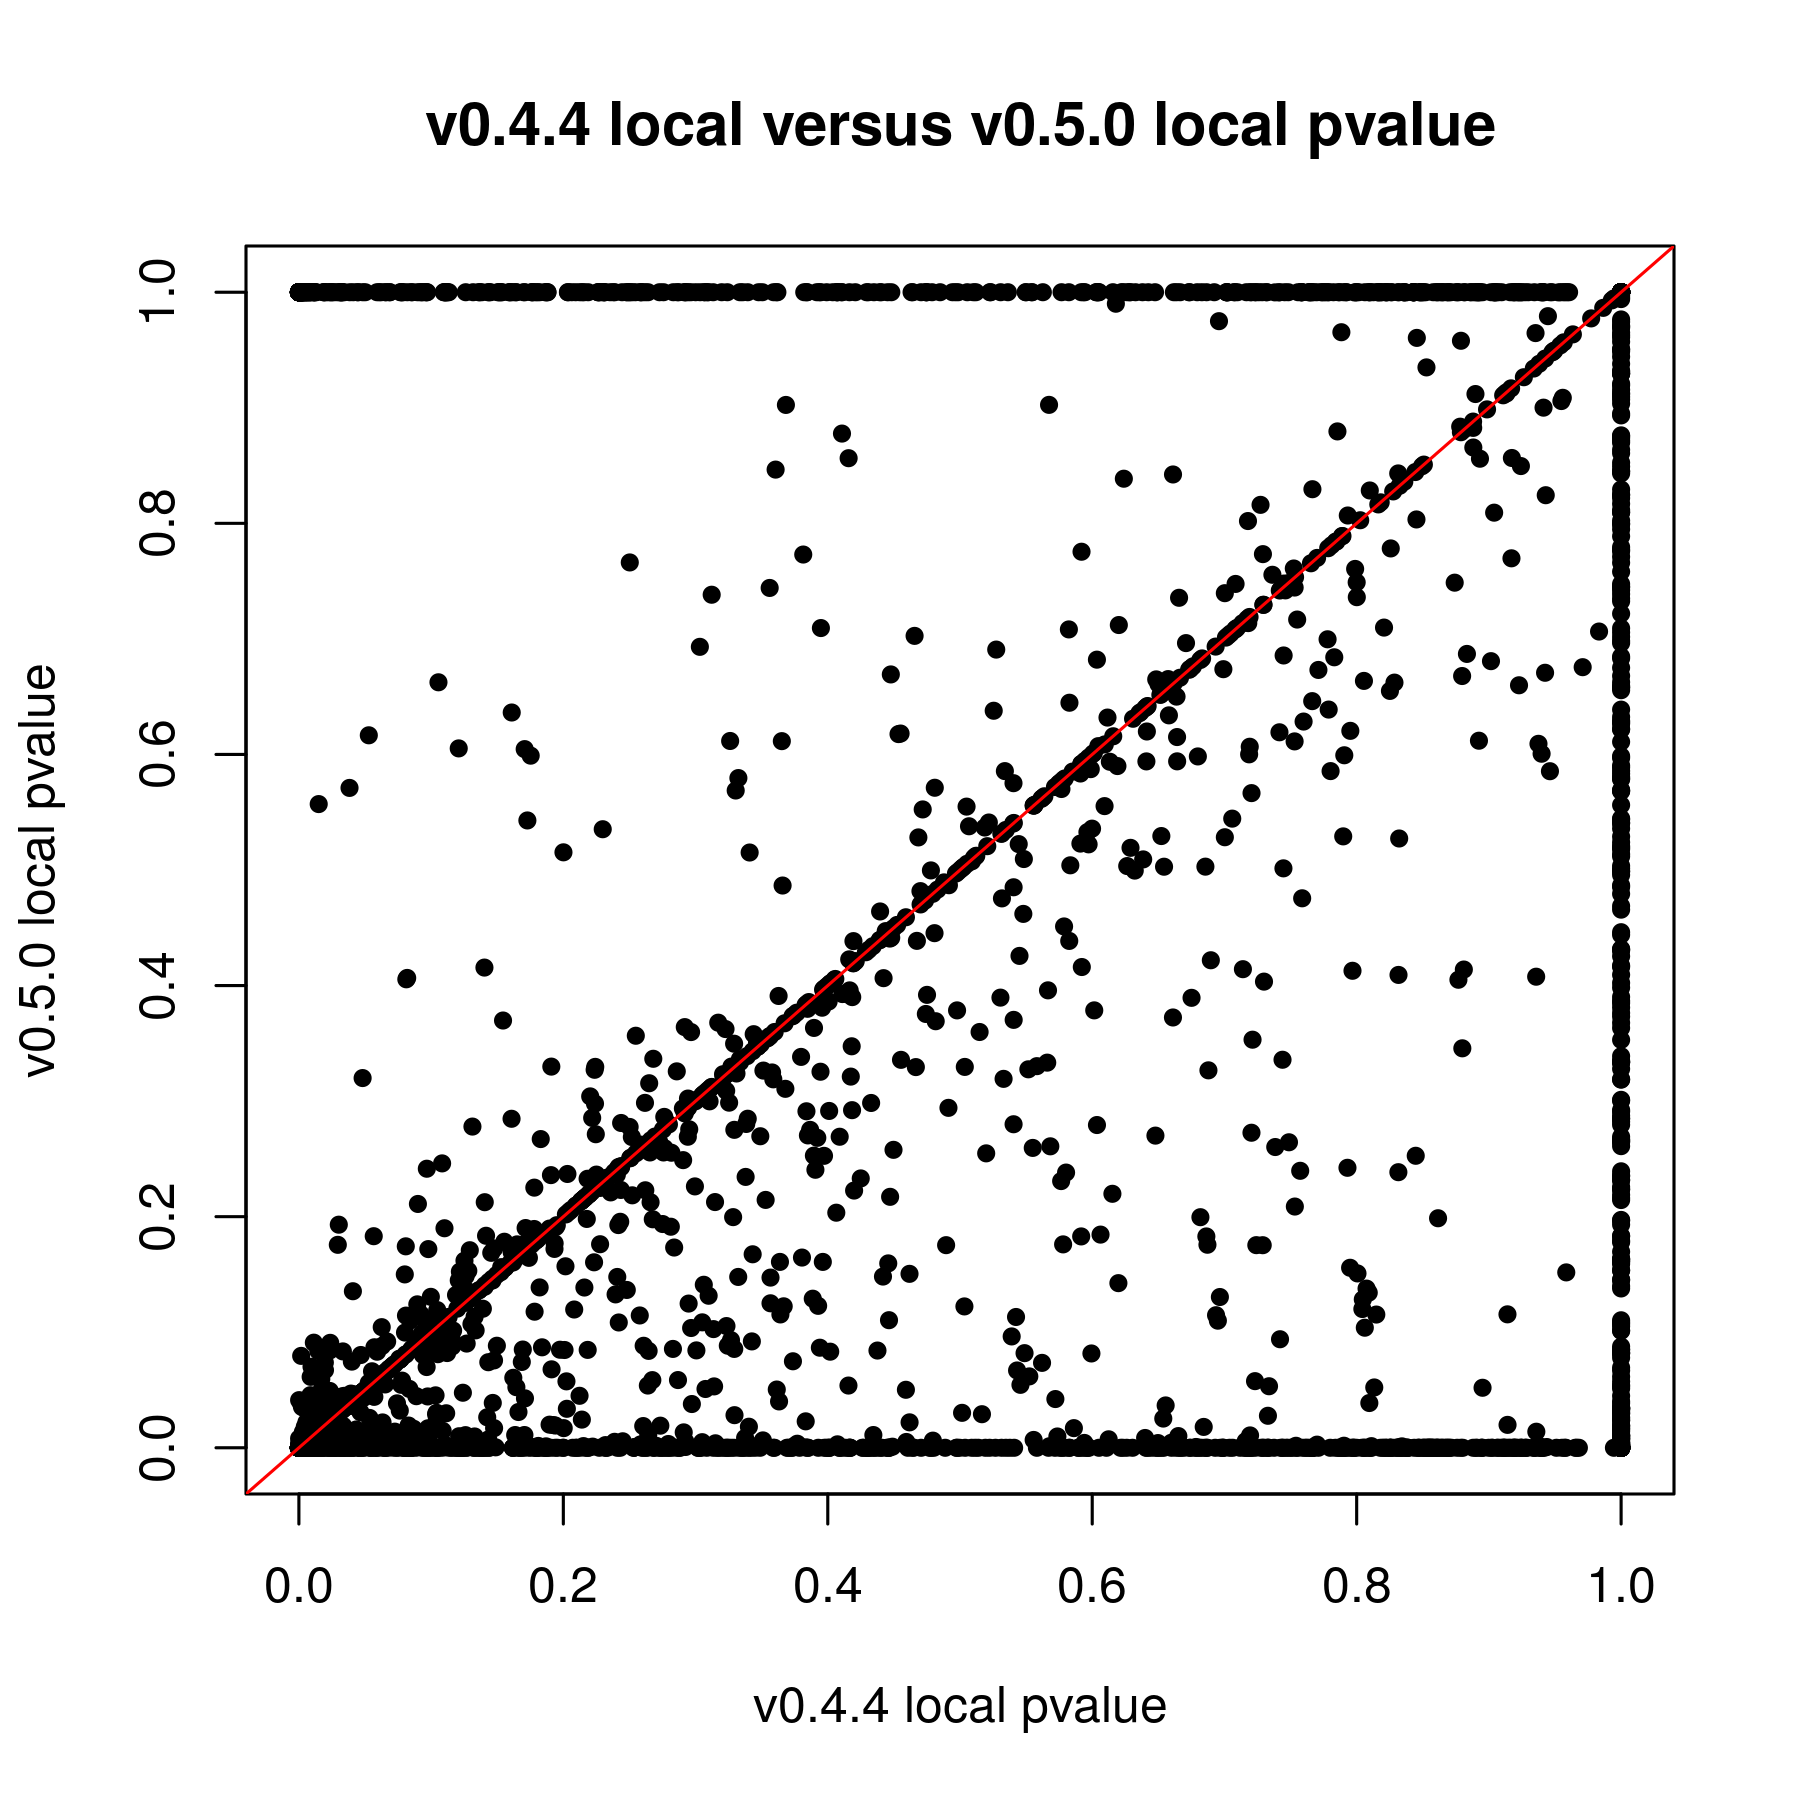
Hello, I took a look at this in more depth over the weekend and found that the refactor to v0.5.0 caused some changes in the local calculation, which you've already noticed. The plots below are the same already in the https://github.com/rcavalcante/methylsig_comparison repo, but for v0.4.4 versus v0.5.0. I tracked the change down two issues:
I am going to discuss this with the authors and will follow up shortly. The case where no local information is used remains the same from v0.4.4 to v0.5.0 to v0.99.4. Thanks for bringing up this issue, it has been helpful to work through. Raymond |
|
Do you have any updates on this issue? |
|
Hi, After discussing with the authors, we've decided that we prefer the current approach that methylSig is taking for local information. Namely, that it will only borrow information from loci that also pass the minimum per group threshold, as the data is "higher quality". Going back to the message that began this thread:
I'm not entirely sure why so many more sites would be p < 0.05 without having the same data to examine. But I will say that it's typically a good idea to impose a methylation difference threshold on loci as well as a p-value/FDR threshold. This goes a long way to reducing false positives. Now the choice of methylation difference threshold is dependent on the biology. In cancer/normal studies you can probably set it pretty high, but for subtler situations, such as with environmental exposures or complex diseases, lower thresholds (5-10%) are probably more appropriate. All that said, this doesn't address the slow-down in using methylation information, and I will deal with that before the next release of Bioconductor in October. Thanks, |
|
Thank you I really appreciate you and your team looking into this for me. Annie |


I have been trying to work with the updated version of methylSig for the last couple weeks. I was reanalyzing data that I put through the old methylSig program and I'm noticing a very large discrepancy in pvalues. My understanding is the old methylSigCalc is the the same test as diff_methylsig. I know I shouldn't be going by the pvalue but I never had sites that were q0.1 significant or less before so I just had to use the pvalue cutoff instead.
When I used the pvalue cutoff of 0.05 in the old version, I got about 48K sites. The qvalues for those sites were all 1. In the new version, I got 272K sites when I filtered for pvalue 0.05. The FDR levels off at 0.8399.
If it is the same test by default, I am not sure why there is so much discrepancy. The only thing I know that was done differently was I kept the local window size 0. I used to set that at 200 but this doesn't seem to really work in the new version (I posted this on another issue page).
Obviously I know I have a lot of false positives but I guess I have to work with what I have. Are there any appropriate filtering recommendations you can make? In the manual, it states that for a large sample size I could switch to chi2. What is a "large" sample size.
The text was updated successfully, but these errors were encountered: