This project provides an api to extract network data from github and a client to draw its force-directed graphs.
It provides you with simple force graphs to very easily analyze the contributions made to a repository.
Repo graphs show contributors and files committed and their relationships. A simple repo graph looks like this:
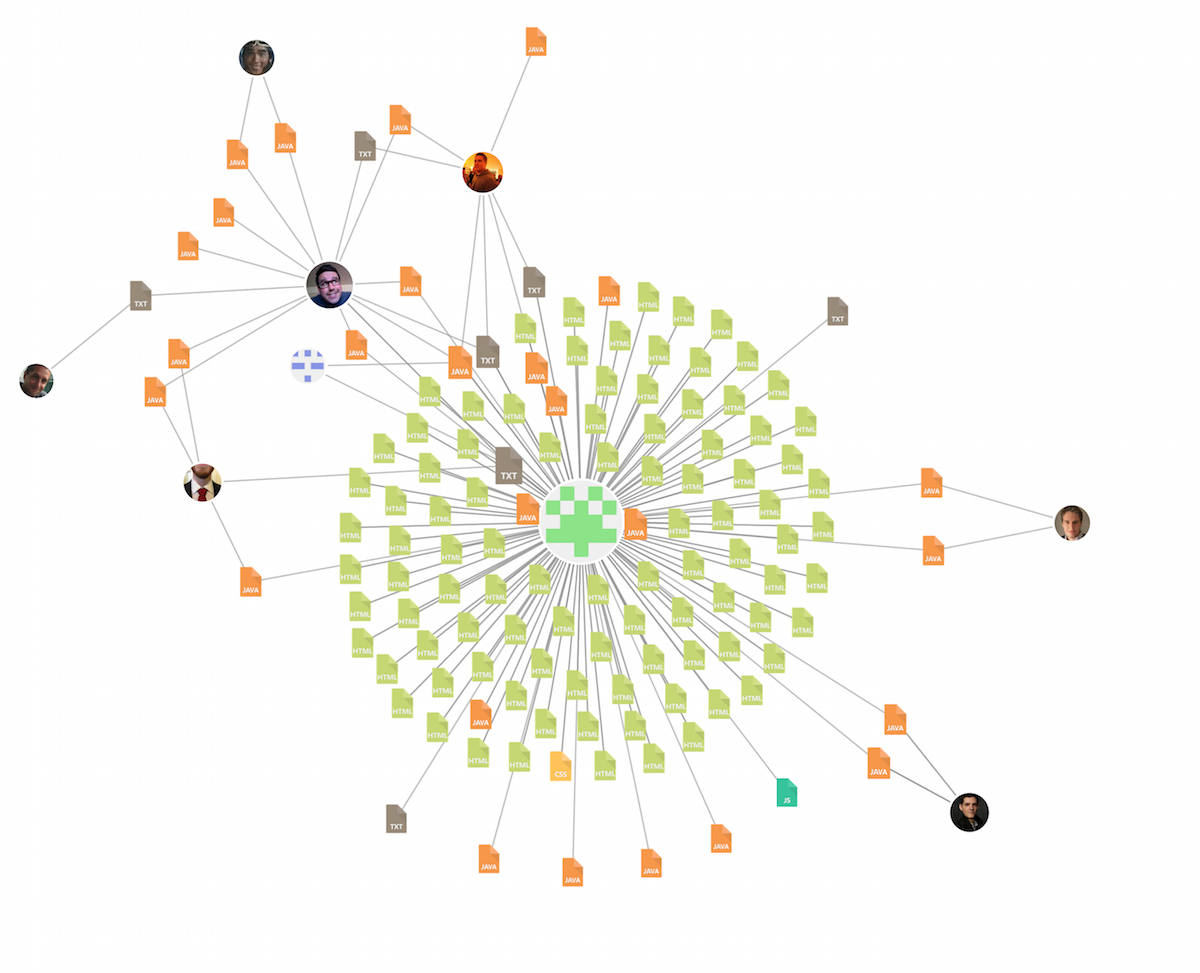
It shows which contributors have affected which files and how nodes are related. Files are distinguished by their type. Rolling over a node shows a tootip with information while clicking on it provides a link to it on github.
Followers graphs are less informational but are still fun to draw :). They provide information about who follows who on github, starting with one single user.

You first need to configure your github access credentials at config.json
npm install
node .
The api provides two main resources which are quite self-explanatory:
/followers-graph?user=xx/repo-graph?user=xx&repo=yy
Client has two available interfaces:
http://localhost:3000/index.htmlshows a simple interface which graphs either a repo or a user graph based on the inputhttp://localhost:3000/graphs.html?username=xxxwhich plays a slide show of all repos available to the organization