-
Notifications
You must be signed in to change notification settings - Fork 61
New issue
Have a question about this project? Sign up for a free GitHub account to open an issue and contact its maintainers and the community.
By clicking “Sign up for GitHub”, you agree to our terms of service and privacy statement. We’ll occasionally send you account related emails.
Already on GitHub? Sign in to your account
Error in prep_tbl_time() #57
Comments
|
I have the exact same issue and this whole package is useless without this function. |
|
Hey, I'm sorry about this. I'm transitioning most of this functionality over to library(timetk)
library(tidyverse)
# Get Anomaly Data
walmart_sales_weekly %>%
group_by(id) %>%
tk_anomaly_diagnostics(
.date_var = Date,
.value = Weekly_Sales
)
#> frequency = 13 observations per 1 quarter
#> trend = 52 observations per 1 year
#> frequency = 13 observations per 1 quarter
#> trend = 52 observations per 1 year
#> frequency = 13 observations per 1 quarter
#> trend = 52 observations per 1 year
#> frequency = 13 observations per 1 quarter
#> trend = 52 observations per 1 year
#> frequency = 13 observations per 1 quarter
#> trend = 52 observations per 1 year
#> frequency = 13 observations per 1 quarter
#> trend = 52 observations per 1 year
#> frequency = 13 observations per 1 quarter
#> trend = 52 observations per 1 year
#> # A tibble: 1,001 x 12
#> # Groups: id [7]
#> id Date observed season trend remainder seasadj remainder_l1
#> <fct> <date> <dbl> <dbl> <dbl> <dbl> <dbl> <dbl>
#> 1 1_1 2010-02-05 24924. 874. 19967. 4083. 24050. -15981.
#> 2 1_1 2010-02-12 46039. -698. 19835. 26902. 46737. -15981.
#> 3 1_1 2010-02-19 41596. -1216. 19703. 23108. 42812. -15981.
#> 4 1_1 2010-02-26 19404. -821. 19571. 653. 20224. -15981.
#> 5 1_1 2010-03-05 21828. 324. 19439. 2064. 21504. -15981.
#> 6 1_1 2010-03-12 21043. 471. 19307. 1265. 20572. -15981.
#> 7 1_1 2010-03-19 22137. 920. 19175. 2041. 21217. -15981.
#> 8 1_1 2010-03-26 26229. 752. 19069. 6409. 25478. -15981.
#> 9 1_1 2010-04-02 57258. 503. 18962. 37794. 56755. -15981.
#> 10 1_1 2010-04-09 42961. 1132. 18855. 22974. 41829. -15981.
#> # … with 991 more rows, and 4 more variables: remainder_l2 <dbl>,
#> # anomaly <chr>, recomposed_l1 <dbl>, recomposed_l2 <dbl>
# Plot Anomalies
walmart_sales_weekly %>%
group_by(id) %>%
plot_anomaly_diagnostics(
.date_var = Date,
.value = Weekly_Sales,
.facet_ncol = 2,
.interactive = FALSE
)
#> frequency = 13 observations per 1 quarter
#> trend = 52 observations per 1 year
#> frequency = 13 observations per 1 quarter
#> trend = 52 observations per 1 year
#> frequency = 13 observations per 1 quarter
#> trend = 52 observations per 1 year
#> frequency = 13 observations per 1 quarter
#> trend = 52 observations per 1 year
#> frequency = 13 observations per 1 quarter
#> trend = 52 observations per 1 year
#> frequency = 13 observations per 1 quarter
#> trend = 52 observations per 1 year
#> frequency = 13 observations per 1 quarter
#> trend = 52 observations per 1 yearCreated on 2020-11-13 by the reprex package (v0.3.0) |
Sign up for free
to join this conversation on GitHub.
Already have an account?
Sign in to comment

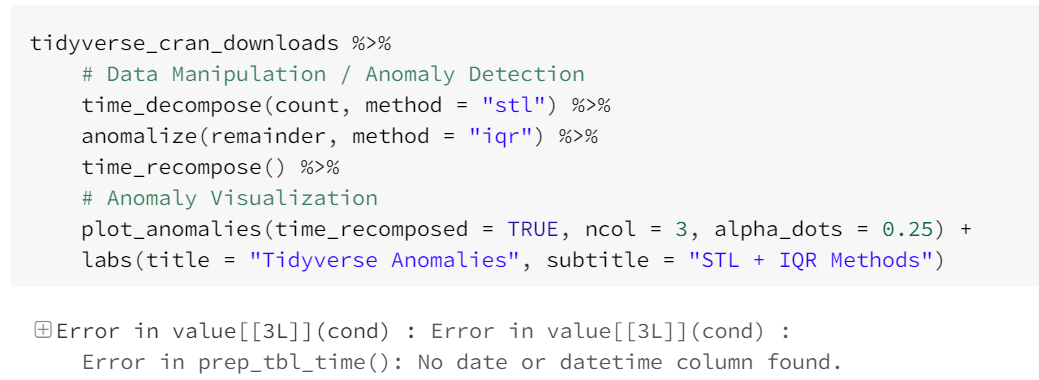
Hi, I run the sample code from https://github.com/business-science/anomalize and there's an issue. Please see below:

I tried the same code on my own tibble table and I got the same error:
Error in value[3L] : Error in value[3L] :
Error in prep_tbl_time(): No date or datetime column found.
The text was updated successfully, but these errors were encountered: