Repository navigation
Expand file tree
/
Copy pathfreesurfer.qmd
More file actions
149 lines (99 loc) · 8.54 KB
/
Copy pathfreesurfer.qmd
File metadata and controls
149 lines (99 loc) · 8.54 KB
1
2
3
4
5
6
7
8
9
10
11
12
13
14
15
16
17
18
19
20
21
22
23
24
25
26
27
28
29
30
31
32
33
34
35
36
37
38
39
40
41
42
43
44
45
46
47
48
49
50
51
52
53
54
55
56
57
58
59
60
61
62
63
64
65
66
67
68
69
70
71
72
73
74
75
76
77
78
79
80
81
82
83
84
85
86
87
88
89
90
91
92
93
94
95
96
97
98
99
100
101
102
103
104
105
106
107
108
109
110
111
112
113
114
115
116
117
118
119
120
121
122
123
124
125
126
127
128
129
130
131
132
133
134
135
136
137
138
139
140
141
142
143
144
145
146
147
148
149
# FreeSurfer Measures {#sec-freesurfer}
```{r}
#| label: setup
library(dplyr)
library(ggplot2)
library(readr)
library(tidyr)
```
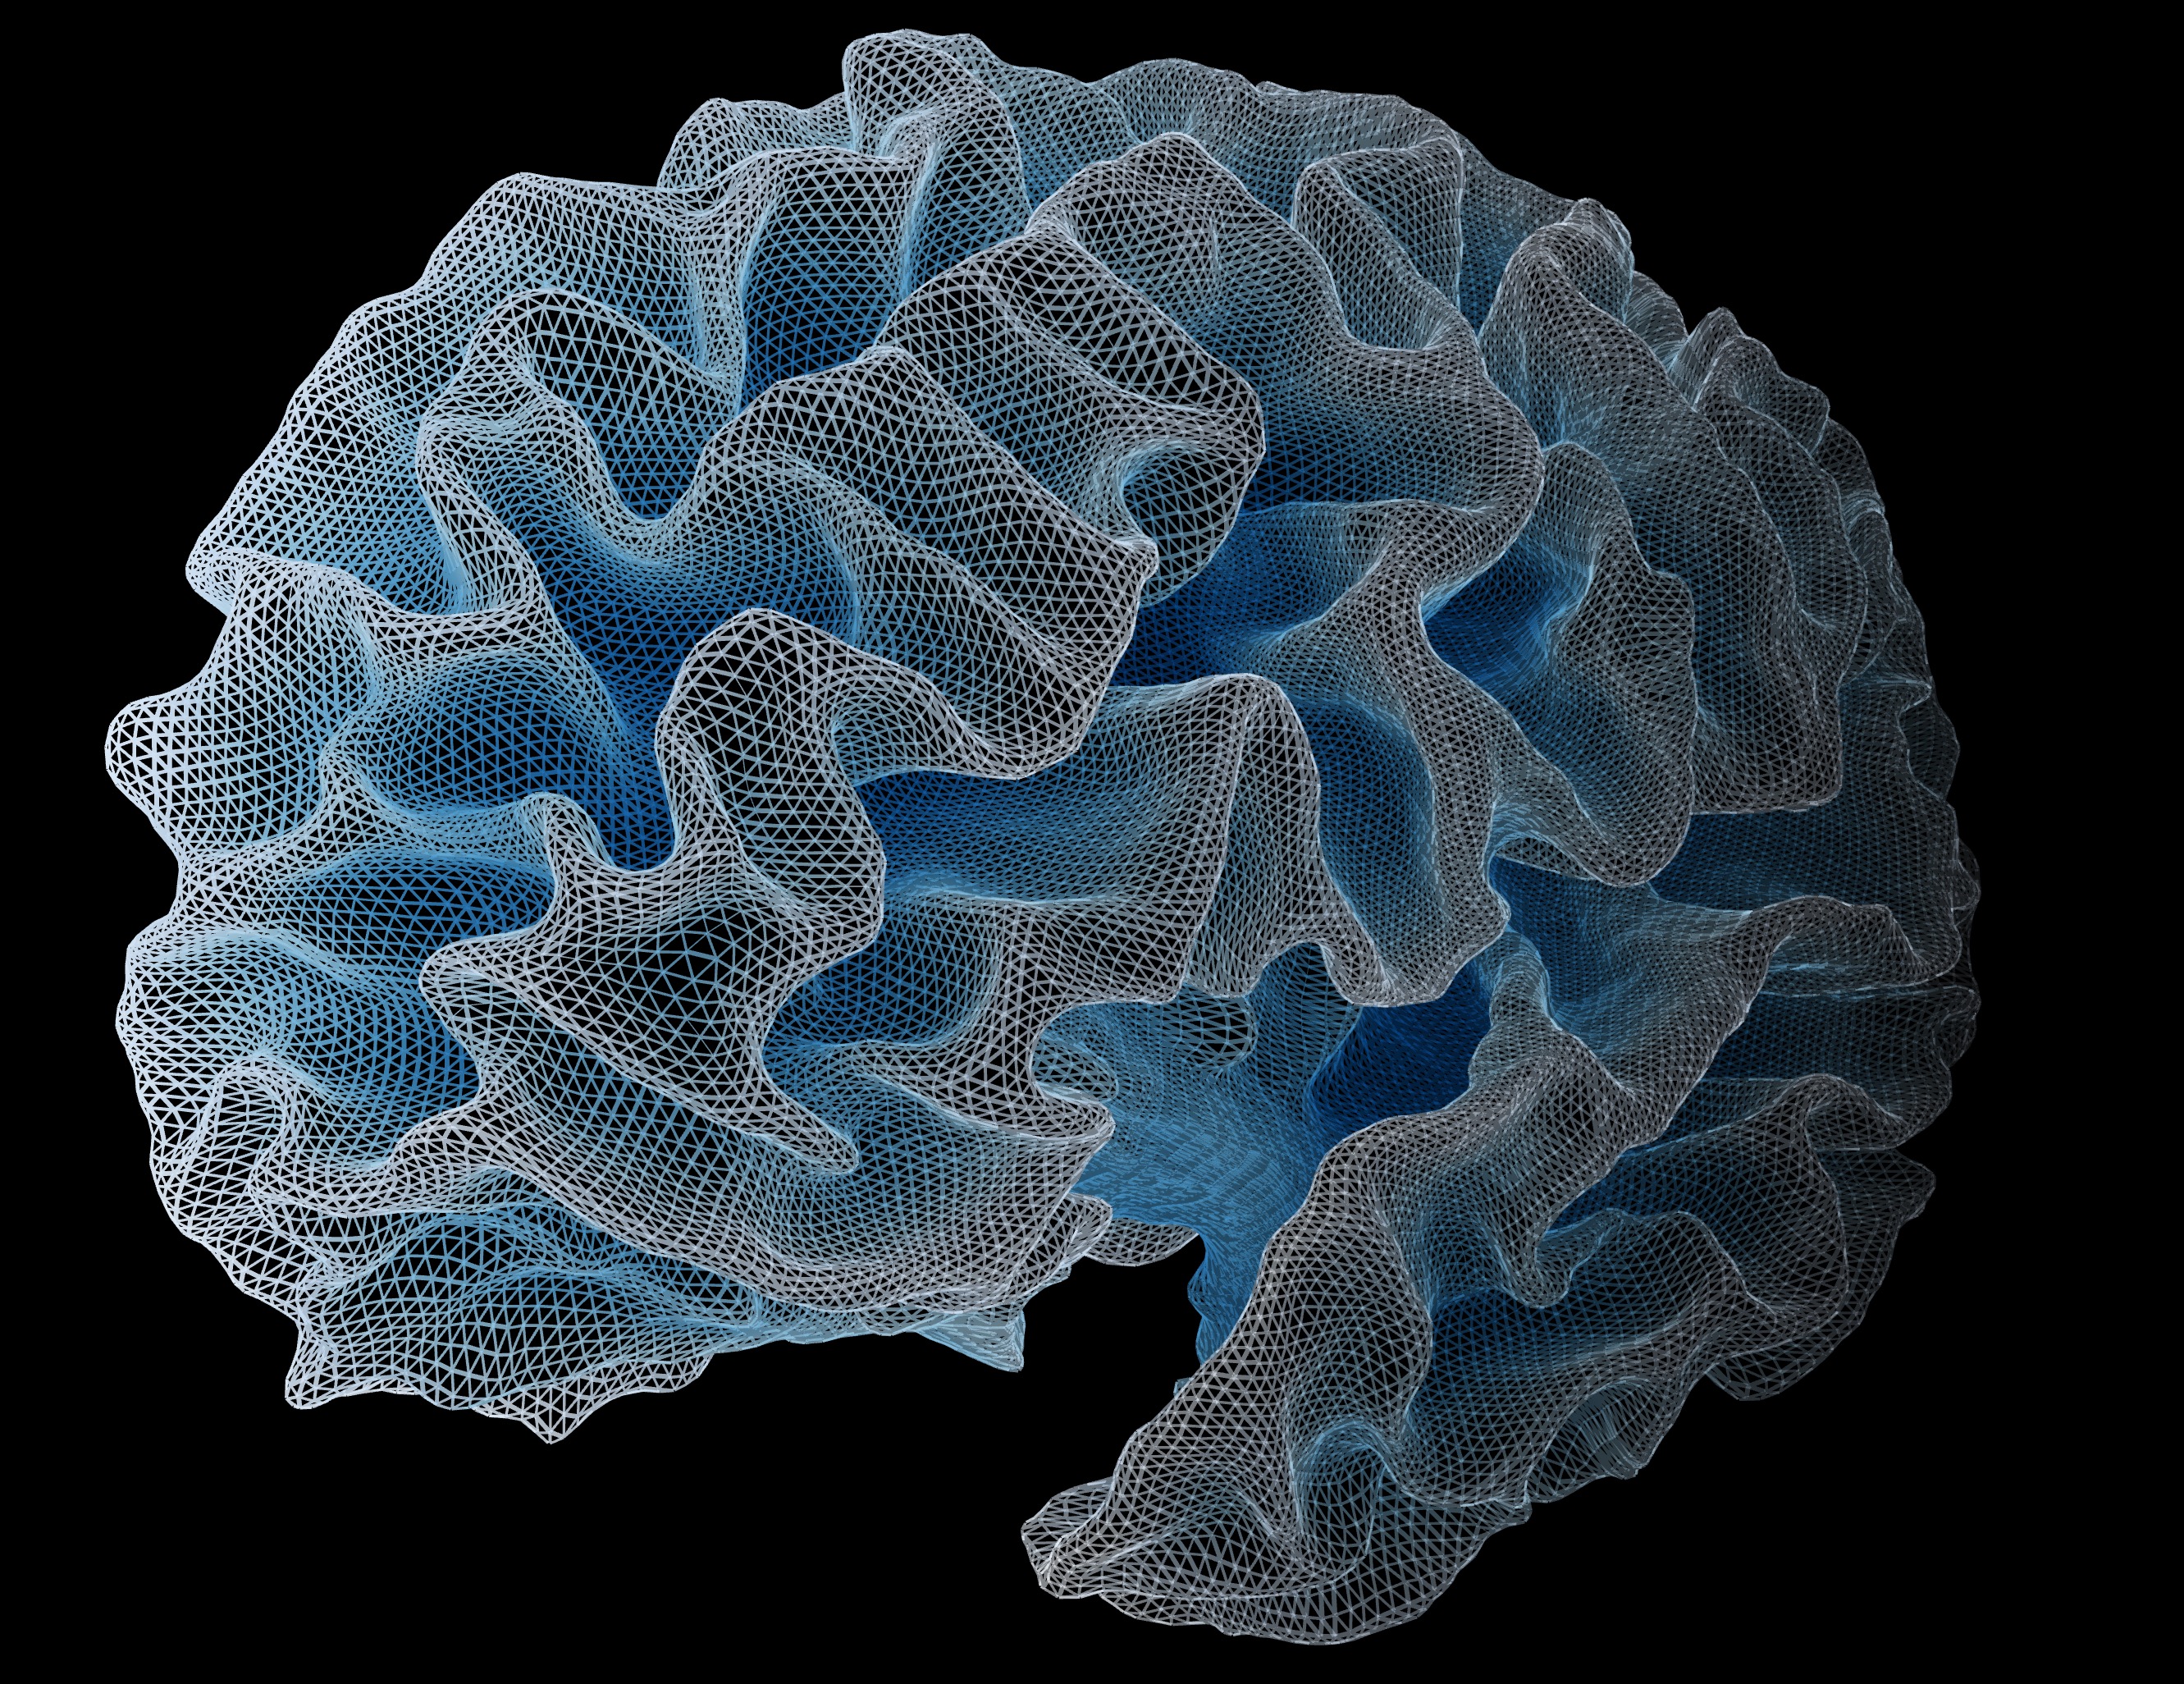
One of the core scans in the A2CPS neuroimaging protocol is a T1w scan, which is used to capture structural information. These scans are processed using a software suite called [FreeSurfer](https://freesurfer.net/). FreeSurfer takes the 3D image, segments it into pre-defined anatomical regions (like the hippocampus or amygdala), and also creates a triangular "mesh" of cerebral cortex from which it derives measurements of structural morphometry, including cortical thickness, surface area, and curvature. These measurements are related to a wide range of diseases, including chronic pain, and are often used as a source of features for predictive modeling. A2CPS has compiled the measurements into tabular files, providing a rich set of neuroanatomical variables ready for statistical analysis to explore brain-behavior relationships or group differences. This kit provides an overview of those tabular files.
## Starting Project
### Locate data
In the release, data are stored underneath the `mris/derivatives` folder:
```bash
{{< var release.root >}}/{{< var release.dir >}}/mris/derivatives/freesurfer
```
This folder contains all of the FreeSurfer outputs for every participant (e.g., this is the directory that could correspond to the FreeSurfer environment variable `$SUBJECTS_DIR`), which subject folders of the form `sub-[recordid]_ses-[protocolid]`.
Most users will not need the raw FreeSurfer outputs and can instead rely on tables in which the morphological measures have been aggregated. There are three relevant tables
- aparc.tsv
- measurements derived from parcellations of the cortical surface (e.g., cortical thickness)
- produced by [`aparcstats2table`](https://surfer.nmr.mgh.harvard.edu/fswiki/aparcstats2table)
- aseg.tsv
- measurements derived from segmentations of the 3d structural image (e.g., average signal intensity)
- produced by [`asegstats2table`](https://surfer.nmr.mgh.harvard.edu/fswiki/asegstats2table)
- headers.tsv
- information about the brain as a whole (e.g., estimated Total Intracranial Volume)
- derived from the headers of the `aparcstats2table` and `asegstats2table` outputs
For each of these, there are data dictionaries in `json` files (e.g., `aparc.json` explains the columns of `aparc.tsv`).
```bash
$ ls mris/derivatives/freesurfer/*{json,tsv}
mris/derivatives/freesurfer/aparc.json mris/derivatives/freesurfer/gm_morph.tsv
mris/derivatives/freesurfer/aparc.tsv mris/derivatives/freesurfer/headers.json
mris/derivatives/freesurfer/aseg.json mris/derivatives/freesurfer/headers.tsv
mris/derivatives/freesurfer/aseg.tsv
```
Copies of the data dictionaries are available online for preview: [aparc.json](https://github.com/a2cps/snapshot/blob/{{< var snapshot.tag >}}/src/snapshot/data/aparc.json), [aseg.json](https://github.com/a2cps/snapshot/blob/{{< var snapshot.tag >}}/src/snapshot/data/aseg.json), [headers.json](https://github.com/a2cps/snapshot/blob/{{< var snapshot.tag >}}/src/snapshot/data/headers.json).
### Extract data
In this kit, we will explore the cortical parcellations.
As described above, the parcellation information is stored in `aparc.tsv`.
```{r}
#| label: load
aparc <- read_tsv(
"data/pre-surgery/mris/derivatives/freesurfer/aparc.tsv",
show_col_types = FALSE
)
head(aparc)
```
That table contains nine regional measurements (GrayVol, SurfArea) for the various structures that compose each of six parcellations.
A typical analysis will only rely on one parcellation. For details of the different parcellations, see the [FreeSurfer documentation](https://surfer.nmr.mgh.harvard.edu/fswiki/CorticalParcellation). Two good starting choices are either `aparc` or `aparc.a2009s`. The `aparc` atlas is a coarser parcellation, whereas `aparc.a2009s` is finer. Here, we'll filter for `aparc.a2009s`.
```{r}
#| label: a2009s
a2009s <- aparc |> filter(parc == "aparc.a2009s")
head(a2009s)
```
### Example Analysis: Relationship between Cortical Surface Area and Gray Matter Volume
One of the most common features in predictive models is cortical thickness, but each of the morphological measurements may carry unique information. For example, cortical surface area may be more predictive of widespread chronic pain as compared to cortical thickness, which may be more closely related to chronic headaches\ [@bhatt_mapping_2024]. Let's compare the regional volume with the regional surface area.
::: {#fig-pairs}
```{r}
#| label: pairs
a2009s |> ggplot(aes(x = SurfArea, y = GrayVol)) + geom_point(alpha = 0.1)
```
Cortical Gray Matter Volume (mm^3) and Surface Area (mm^2). Each point represents a single pair of measurements for a single region within a participant.
:::
Clearly, there are groupings in the data. These groupings could partly be driven by participant demographics (e.g., some participants having larger or smaller regional volumes), but they may also be driven by different structures (e.g., the relationship between surface area and volume may differ across regions). Let's zoom in on two of the larger clusters, and color the points by structure.
::: {#fig-pairs2}
```{r}
#| label: pairs-thickness
a2009s |>
filter(between(SurfArea, 4000, 6000), between(GrayVol, 10000, 20000)) |>
ggplot(aes(x = SurfArea, y = GrayVol, color = StructName)) +
geom_point()
```
The data are plotted as in @fig-pairs, but with a restricted axis. Note the apparent variability in the relationship between surface area and volume.
:::
The relationship between surface area and volume appears to vary by region. For example, the Superior Temporal Sulcus has a similar surface area to the Superior Frontal Gyrus, but that gyrus has a larger volume.
## Considerations While Working on Projects
### Pivoting the Data
The data have been shared in a ["longer" format](https://r4ds.hadley.nz/data-tidy.html#sec-tidy-data), with rows corresponding to region-level observations. Some analyses benefit from having the data in a ["wider" format](https://r4ds.hadley.nz/data-tidy.html#widening-data), with rows corresponding to participant-level observations. For example, if we're predicting age from cortical thickness, we may want to drop the other morphological measures, and pivot the table such that columns correspond to regional thickness.
::: {#tbl-wide}
```{r}
#| label: wider
a2009s |>
select(StructName, ThickAvg, sub, hemisphere) |>
pivot_wider(names_from = c(StructName, hemisphere), values_from = ThickAvg) |>
head()
```
Average Thickness in a Wider Format. Rows correspond to participants. Note that the region (`StructName`) has been combined with the hemisphere label.
:::
### Variability Across Scanners
{{< include _snippets/mri-scanner-variability.qmd >}}
### Data Quality
{{< include _snippets/mri-qc.qmd >}}
Currently, no QC has been performed on the underlying segmentations and parcellations. With adequate sample sizes, results based on whole-atlas FreeSurfer measurements are generally robust, although there are individual regions that may warrant close inspection (e.g., [McCarthy et al. 2015](http://dx.doi.org/10.3389/fnins.2015.00379), [Vahermaa et al. 2023](https://doi.org/10.1016/j.neuroimage.2023.120306)). Moreover, it remains unclear the extent to which FreeSurfer's accuracy persists over the wide range of demographics found in the A2CPS dataset. The Imaging DIRC is actively exploring these aspects of quality.
### Methods
FreeSurfer outputs were generated by the [fMRIPrep pipeline](https://fmriprep.org/en/stable/workflows.html#surface-preprocessing). The fMRIPrep pipeline is similar to a typical call to FreeSurfer's `recon-all`, with a majority of changes aiming to parallelize more parts of `recon-all`. However, there are differences, such as in how the brain is masked. The A2CPS use of fMRIPrep is even more different because it entails replacing the fMRIPrep masking procedure with [`SynthStrip`](https://surfer.nmr.mgh.harvard.edu/docs/synthstrip/). In general, these changes are expected to only improve the quality of the FreeSurfer outputs. However, they may hinder some comparisons between results derived from A2CPS and those in other studies.
### Citations
The FreeSurfer package has been developed through extensive research. If you use these derivatives in your analyses, please follow the documentation for citing FreeSurfer: https://surfer.nmr.mgh.harvard.edu/fswiki/FreeSurferMethodsCitation.
{{< include _snippets/a2cps_citations.qmd >}}
When using neuroimaging derivatives, please also cite @sadil_acute_2024.