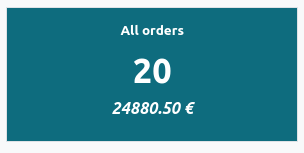
This module extends the web module to add new dashboard overview system.
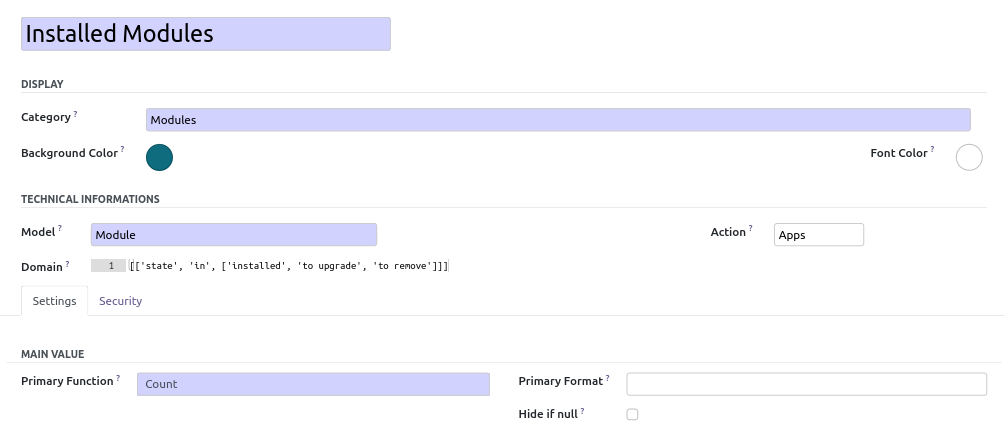
By default, the tile displays items count of a given model restricted to a given domain.
Optionally, the tile can display the result of a function on a field.
- Function is one of
sum,avg,min,maxormedian. - Field must be integer or float.
Tile can be:
- Displayed only for a user.
- Global for all users.
- Restricted to some groups.
Note: The tile will be hidden if the current user doesn't have access to the given model.
Table of contents
First, you have to create tile categories.
- Go to "Dashboards > Configuration > Overview Settings > Dashboard Categories"
- Create categories
Odoo menu and action are automatically created in the "Dashboard > Overview" menu You should refresh your browser to see new menu items.
Then you can create tiles.
- Go to "Dashboards > Configuration > Overview Settings > Dashboard Items"
- create a new tile, set a name, a category and a model.
- You can optionally define colors, domain and a specific action to use.
- Setting a user, or a group in "Security" tab will restrict the display of the tile.
You can optionally define a secondary value, for that purpose :
- Select a field, a function to apply.
- You can define a specific format. (
.format()python syntax)
- Go to "Dashboard > Overview" and select a category
- The tile configured is displayed with the up to date count and average values of the selected domain.
- By clicking on the item, you'll navigate to the tree view of the according model.
Known issues
- Can not edit color from dashboard
- Original context is ignored.
- Original domain and filter are not restored.
- To preserve a relative date domain, you have to manually edit the tile's domain from "Configuration > User Interface > Dashboard Tile". You can use the same variables available in filters (
uid,context_today(),current_date,relativedelta).
Roadmap
- Add icons.
- Support client side action (like inbox).
- Restore original Domain + Filter when an action is set.
- Posibility to hide the tile based on a field expression.
- Posibility to set the background color based on a field expression.
Bugs are tracked on GitHub Issues. In case of trouble, please check there if your issue has already been reported. If you spotted it first, help us to smash it by providing a detailed and welcomed feedback.
Do not contact contributors directly about support or help with technical issues.
- initOS GmbH & Co. KG
- GRAP
- Iván Todorovich <[email protected]>
- Markus Schneider <markus.schneider at initos.com>
- Sylvain Le Gal (https://twitter.com/legalsylvain)
- Iván Todorovich <[email protected]>
This module is maintained by the OCA.

OCA, or the Odoo Community Association, is a nonprofit organization whose mission is to support the collaborative development of Odoo features and promote its widespread use.
Current maintainer:
This module is part of the OCA/web project on GitHub.
You are welcome to contribute. To learn how please visit https://odoo-community.org/page/Contribute.


